
Updated August 2026
Lake Water Quality Articles
EPA Water Quality Portal & WI DNR
What the LakeQuality Articles Cover
Lake water quality data is rich across the United States (49 states), Canada (Ontario, Québec, Nova Scotia, British Columbia and Newfoundland and Labrador), and 38 other country hubs. we cover — between state agencies like MPCA and WI DNR, USGS, and citizen monitoring programs, the EPA Water Quality Portal aggregates millions of measurements across tens of thousands of monitored lakes in those states. That depth supports questions you cannot answer at the level of a single lake summary: do deeper lakes really have cleaner water, and by how much? Which lakes have improved most over the past decade, and what changed? How widely have zebra mussels spread, and which counties are next in line?
The articles fall into three groups: analysis that looks for patterns across many lakes, rankings that show the top and bottom of the data on a single measurement, and guides for readers learning to interpret the measurements. Every article is dated, cites the data behind it, and is re-checked when the agencies publish new monitoring records.
Analysis
Data analysis using EPA Water Quality Portal records and DNR LakeFinder attributes — looking for patterns across thousands of lakes that no single lake summary surfaces.
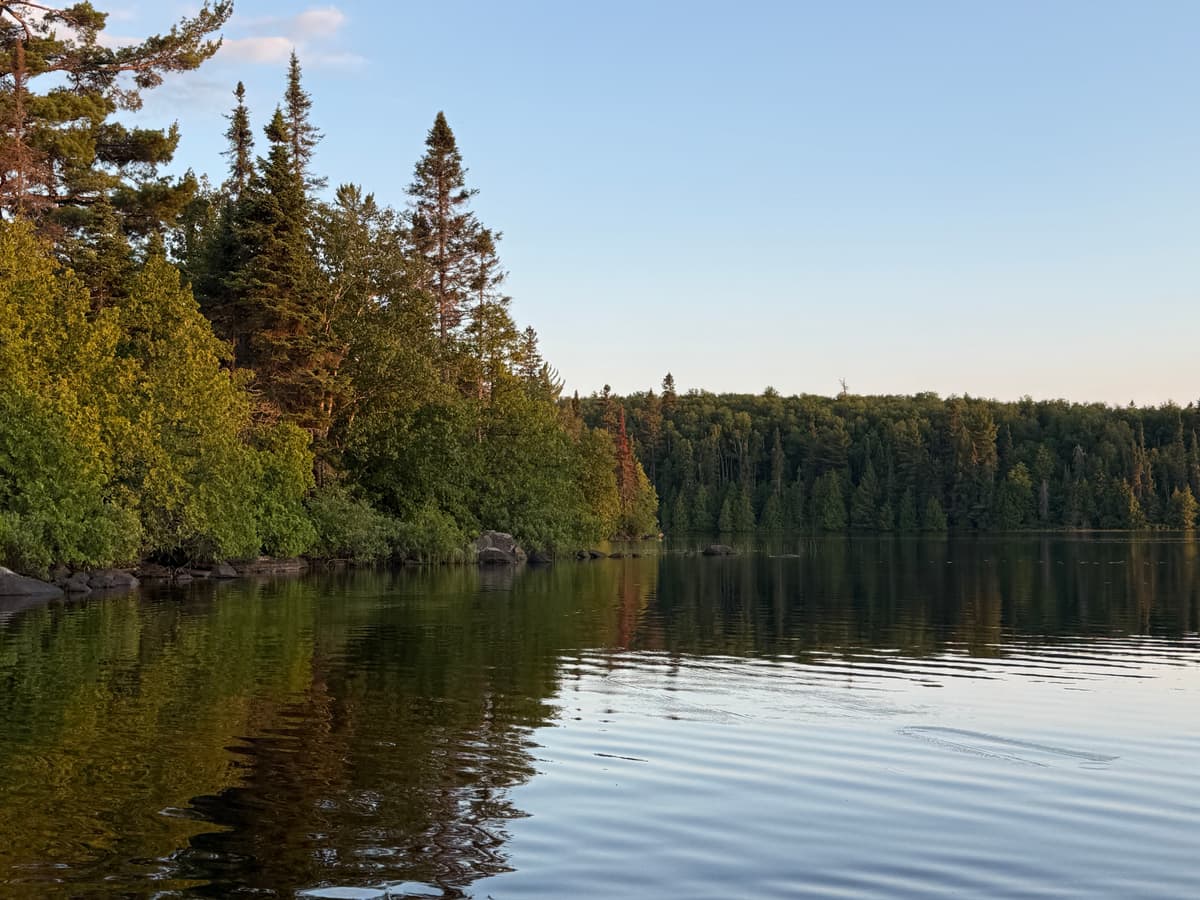
Are Reservoirs Cleaner Than Natural Lakes?
Dam-built reservoirs and natural lakes compared side by side on the same nutrient and algae measurements — the gap, the reasons behind it, and the exceptions.
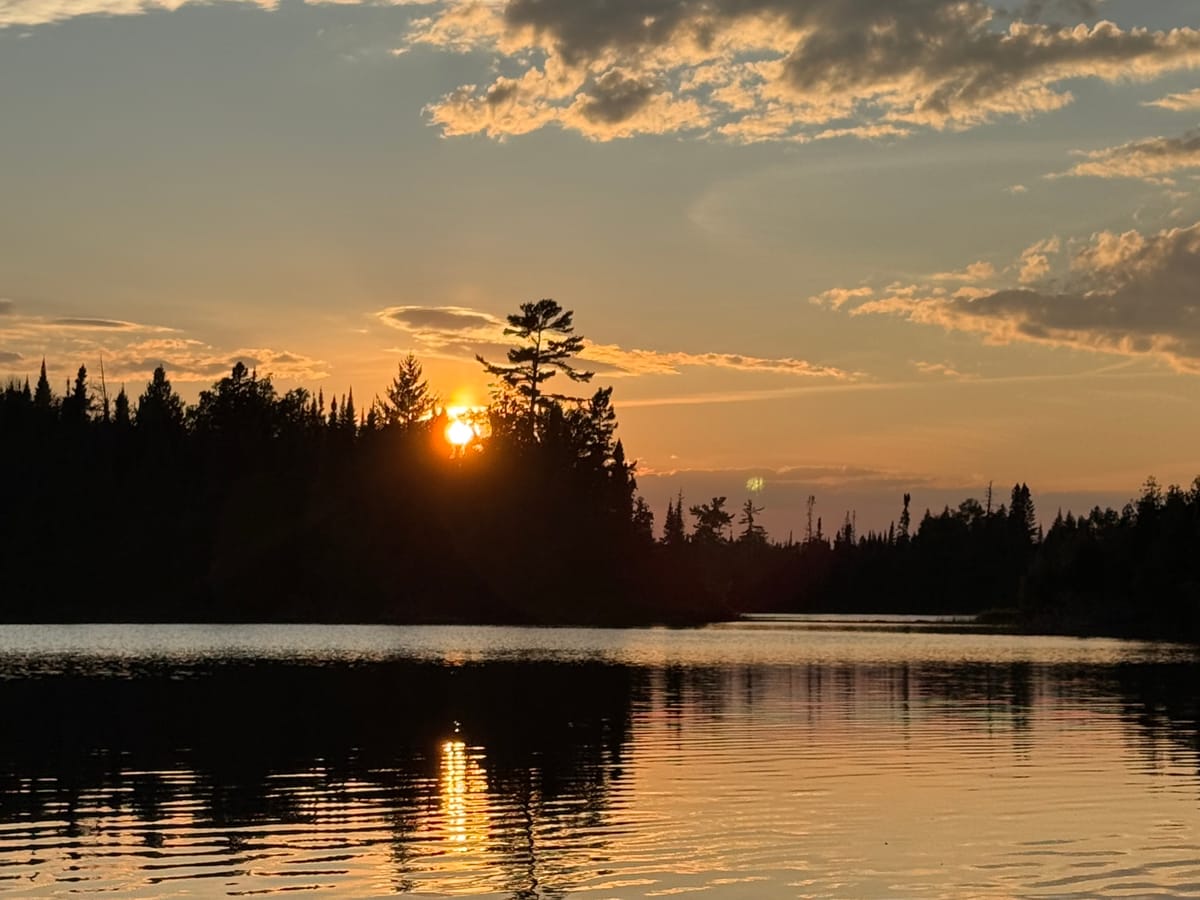
Best Month to Swim, by State — Typical Lake Temperatures
The month when the cleanest lakes in each state are typically warmest, from long-run Water Quality Portal readings rather than this year’s weather.
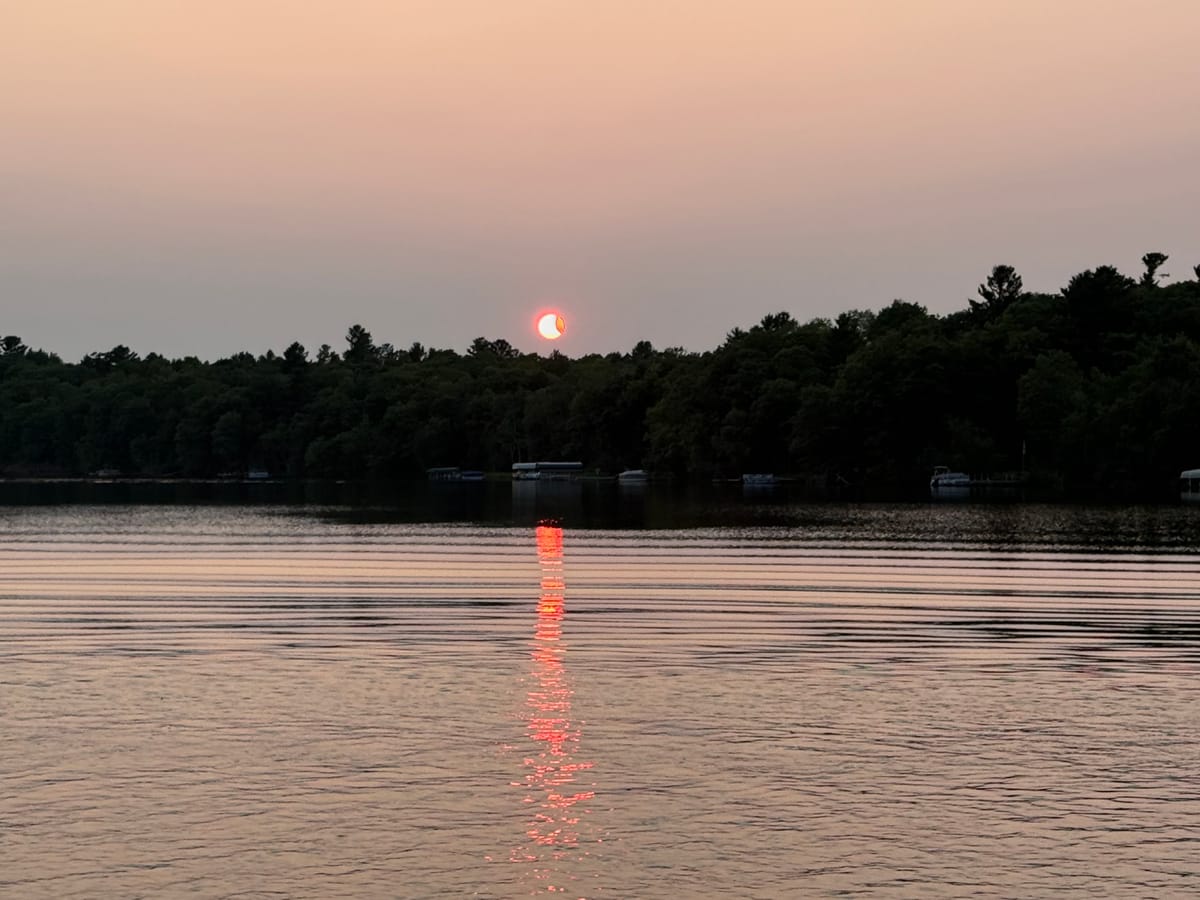
Is Lake of the Ozarks Clean? What the Monitoring Shows
What the EPA nutrient and algae classes say about the sampled stretches of Lake of the Ozarks, and what that means for swimming, boating, and cove choice.
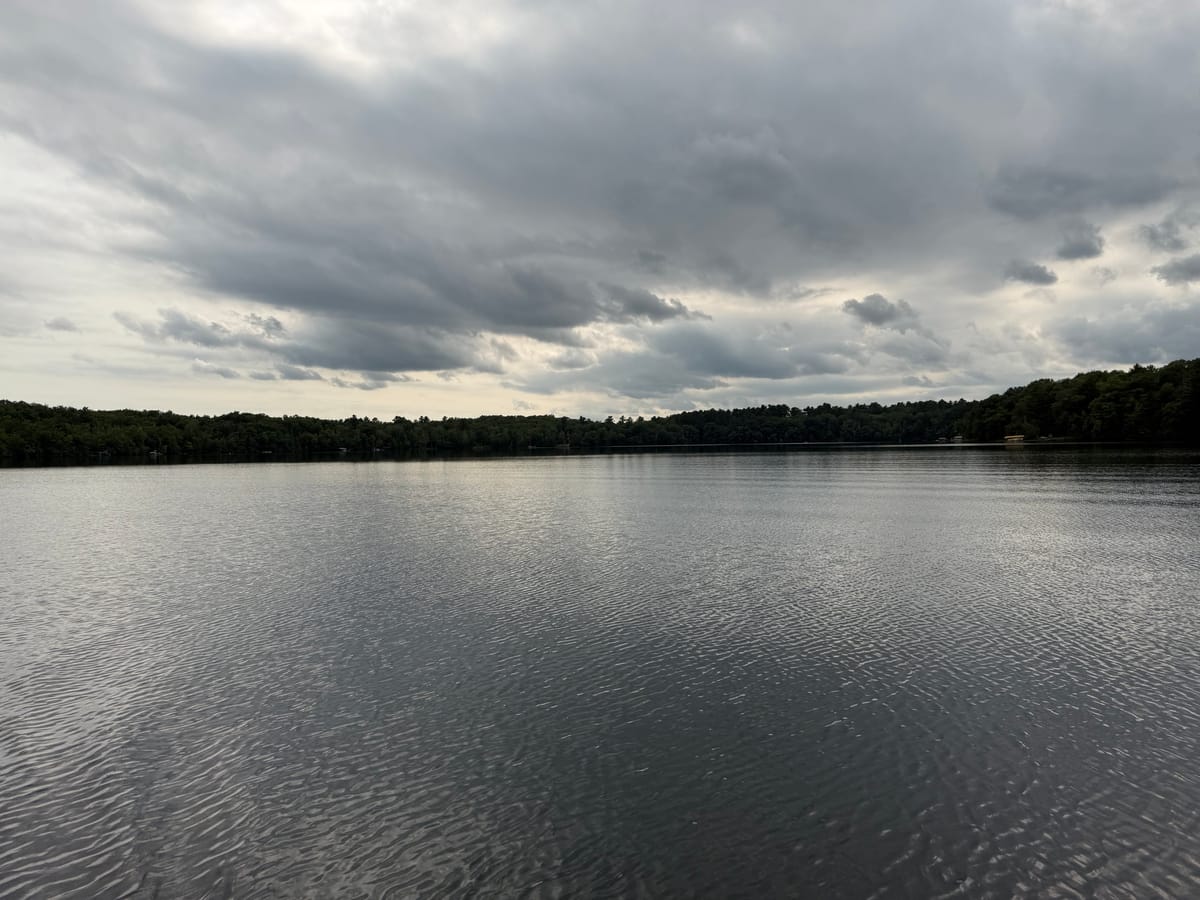
Deepest Lakes in America and How Clean They Are
The deepest lakes with measurements on record, ranked by maximum depth with their nutrient and algae readings alongside. Depth helps on average — it does not decide the water.
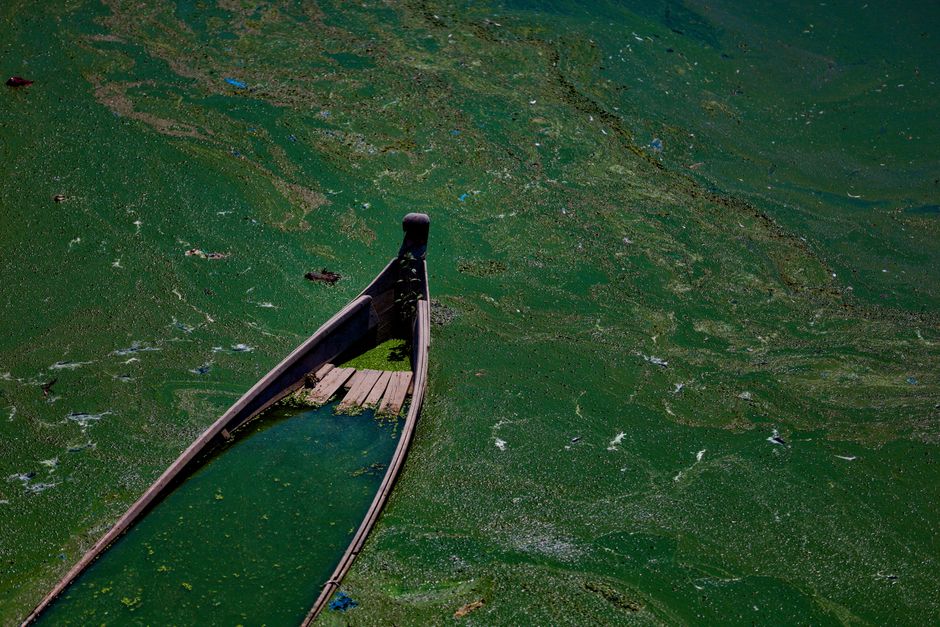
Algae Season 2026: The States With the Most Advisories
Where harmful-algae risk concentrates heading into summer 2026 — the states and lakes with the most nutrient impairment and elevated algae signals.
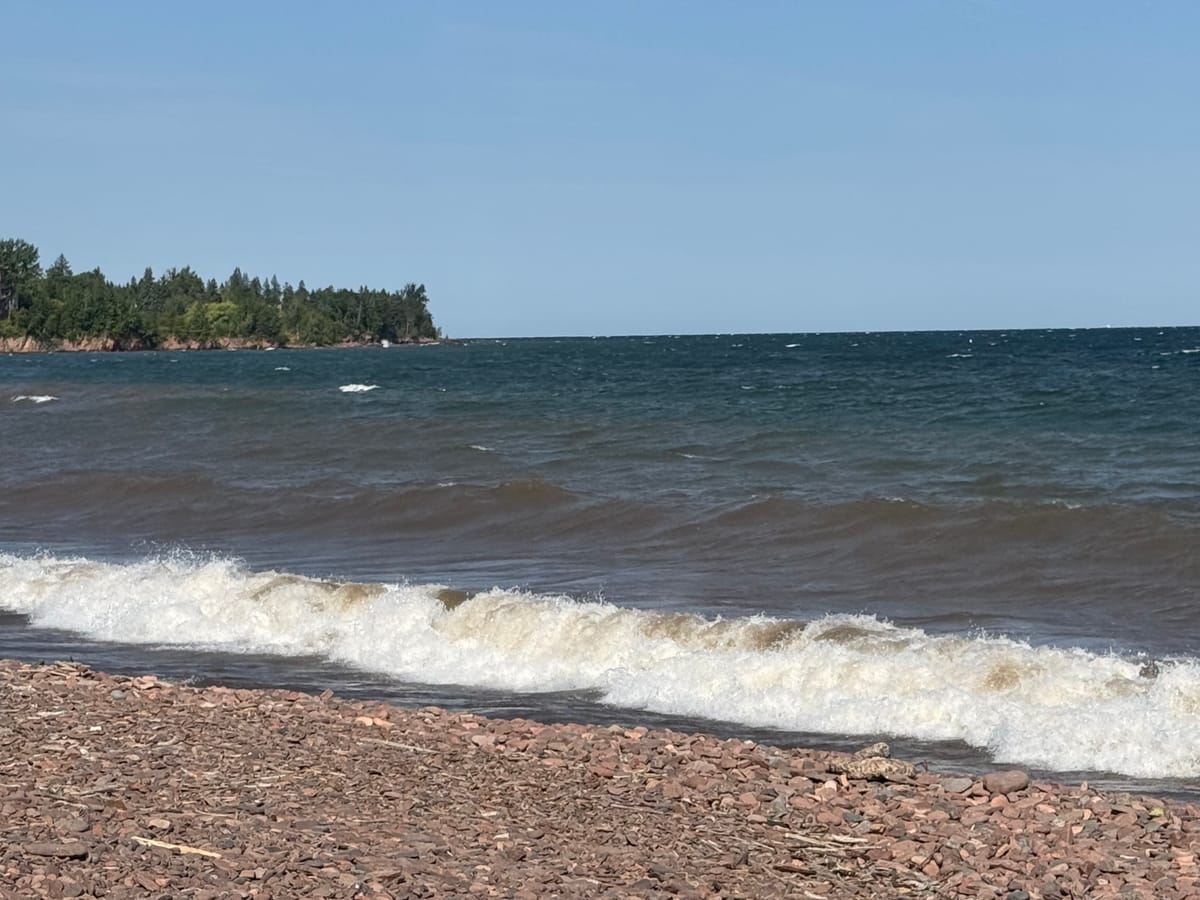
The State of America's Lakes 2026
A data snapshot of the lakes we track: the clearest and the greenest states, and where the water is improving.
The Lakes Where Water Quality Is Slipping
The lakes with the steepest multi-year declines in clarity and the sharpest rises in nutrients, what is driving the drop, and which ones may recover.
Fishing Opener 2026: What the Water Data Shows
Water temperature and level readings from USGS gauges heading into the 2026 fishing opener, and what clarity and conditions mean for early-season fishing.
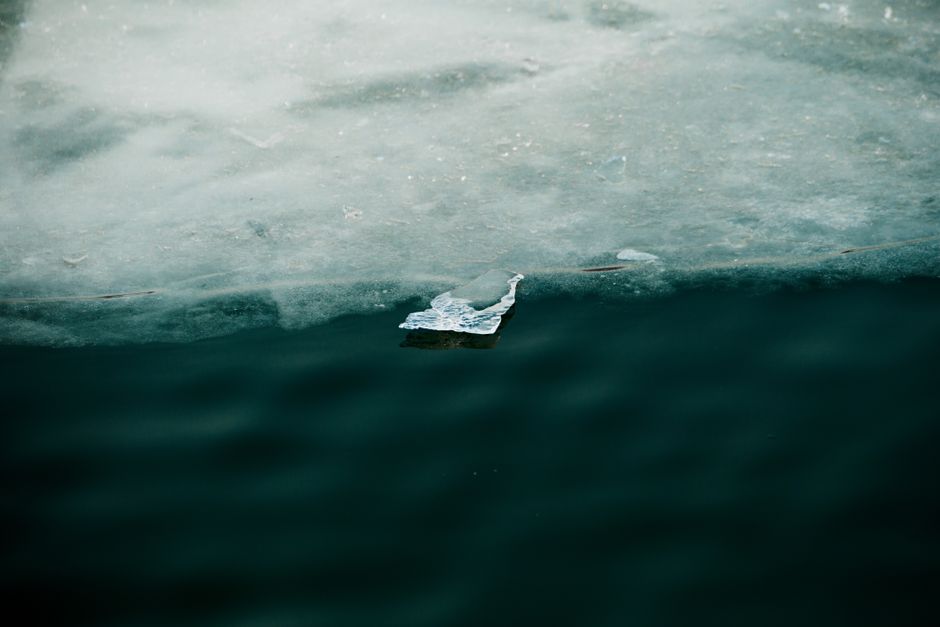
Ice-Out 2026: When Minnesota Lakes Actually Thawed
2026 ice-out dates for Minnesota lakes versus long-term medians, using DNR ice records — the earliest and latest thaws and what they signal.
Do Deeper Lakes Have Better Water Quality?
Surveyed maximum depth against nutrient and algae readings: the pattern, the shallow lakes that still read clean, and why land use beats bathymetry.
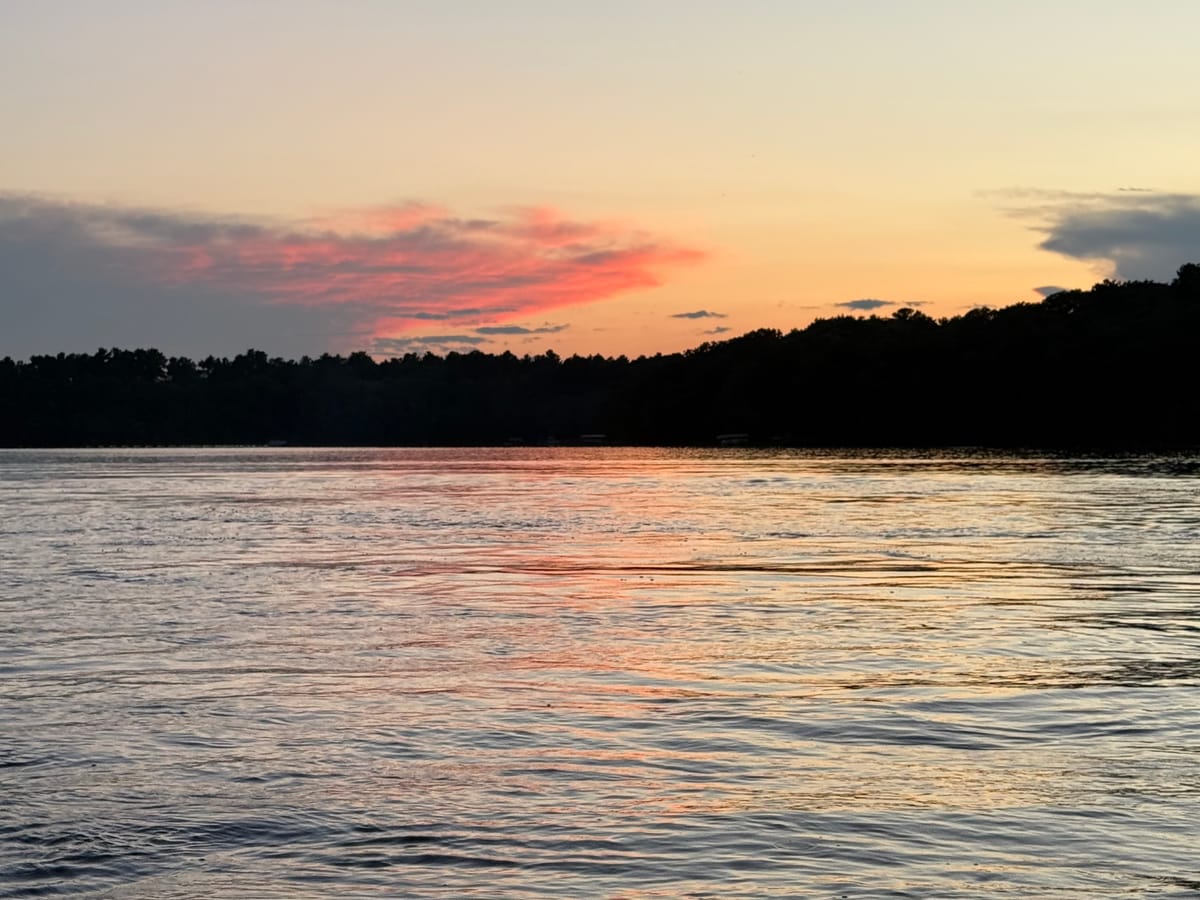
Lakes Making a Water-Quality Comeback
Which lakes are actually improving: multi-year EPA monitoring trends, the named recoveries still in progress, and what it takes to move the readings.
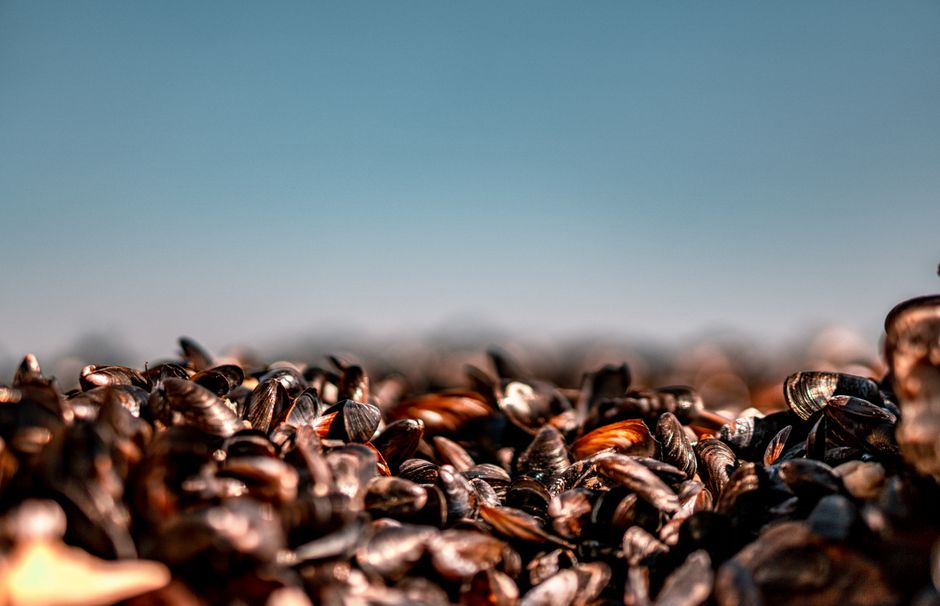
Zebra Mussel Spread: How Many Lakes Are Affected?
Zebra mussel counts from the lakes LakeQuality tracks, the counties that show up most often, and the Clean, Drain, Dry rules that still matter.
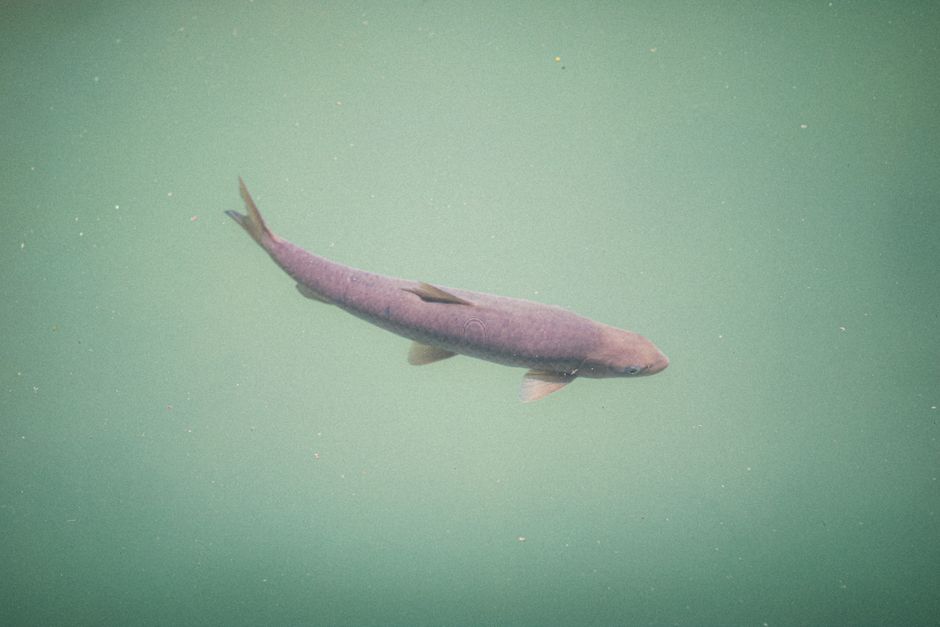
Which Lakes Have the Most Fish Species?
Lakes with the longest DNR fish-survey species lists, which states the surveys cover, and how that diversity lines up with water-quality readings.
Ranking
Ranked tables drawn directly from EPA monitoring data and state natural-resource agency records, with the measurements behind each position shown alongside it.
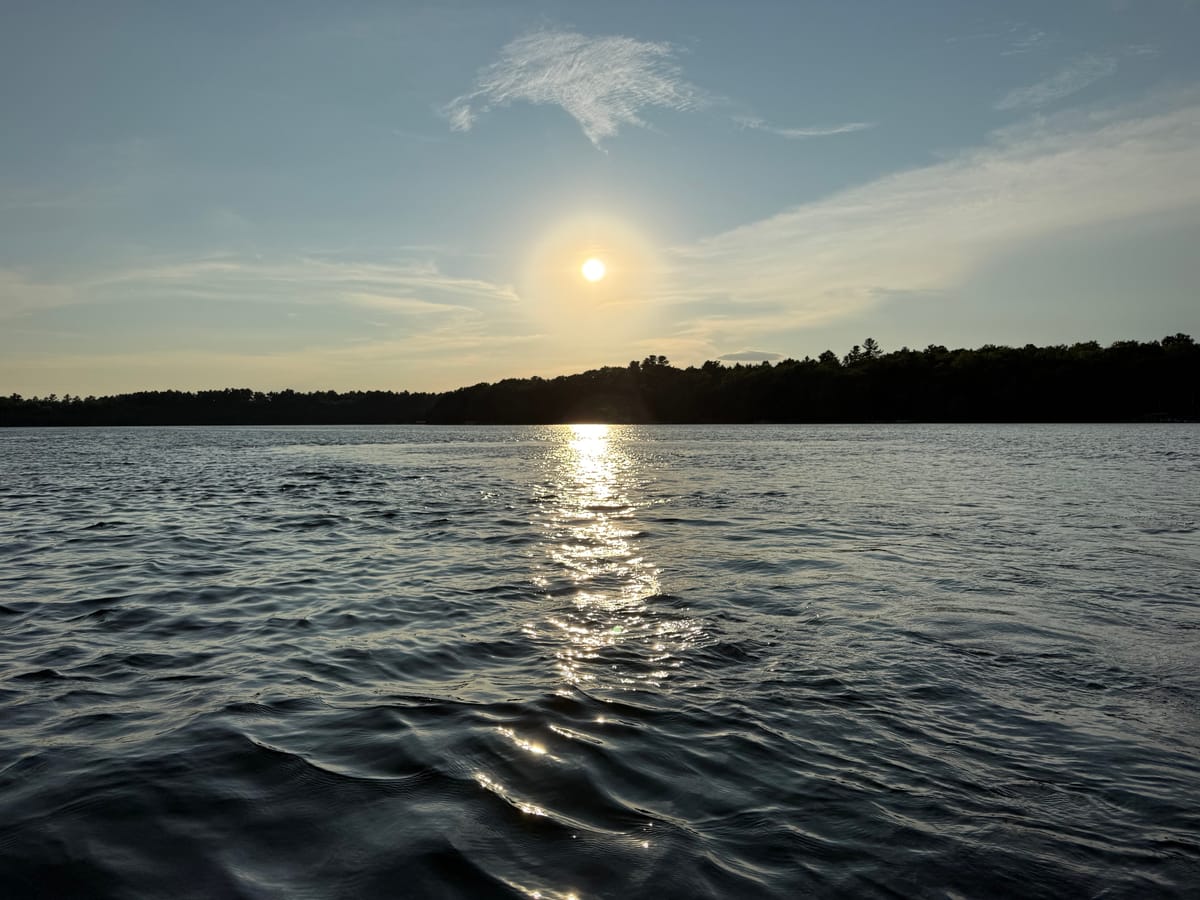
Cleanest Small Lakes in America 2026
The cleanest U.S. lakes under 500 acres, ranked on measured nutrients, algae, and water clarity — with the size cutoff applied to the lake, not the sample.
Drive-To Clean Lakes From 20 U.S. Metros
The nearest lake with favourable nutrient and algae readings and public access within a 120-mile drive of 20 major U.S. metros — and the metros with no match.
Clearest Lakes in America 2026: Ranked by Secchi Clarity
The clearest lakes in America, ranked by measured Secchi depth in feet from EPA monitoring data — and why the famously clear lakes are missing.
Summer 2026: The Cleanest Lakes to Swim Right Now
The cleanest lakes to swim this summer, ranked on measured clarity and low algae — plus the same-day checks a seasonal reading cannot make for you.
The Clearest Lake in Every County We Track
County-by-county Secchi champions: the clearest measured lake in each county, the murkiest county winners, and why a county title is not a national one.
Best Lakes for Swimming in America, Ranked (2026)
The cleanest lakes for swimming, ranked on EPA nutrient and algae data — plus the one thing a reading cannot tell you the day you go.
Guide
How-to coverage for first-time lake data readers — what each measurement means, how the readings are classified, and how to use them.
Lake Water Temperature by Month: How Warm Lakes Get
Typical lake surface temperatures month by month and state by state, from years of monitoring readings — when lakes warm up, how warm they get, and when they turn.
Impaired Lakes Explained: What an EPA Listing Means
What it means when a lake is listed as impaired, why mercury is the most common reason, and why a listed lake can still be clear water with favourable readings.
What to Check Before Buying Lakefront Property
Before you buy lakefront, check the water: clarity trend, nutrient impairment, algae advisories, invasive species, and depth — a data-backed checklist.
How to Choose a Clean Lake for a Cabin or Weekend Trip
A practical checklist for picking a lake with good water quality — clarity, phosphorus, algae history, depth, and the data to check before you commit.
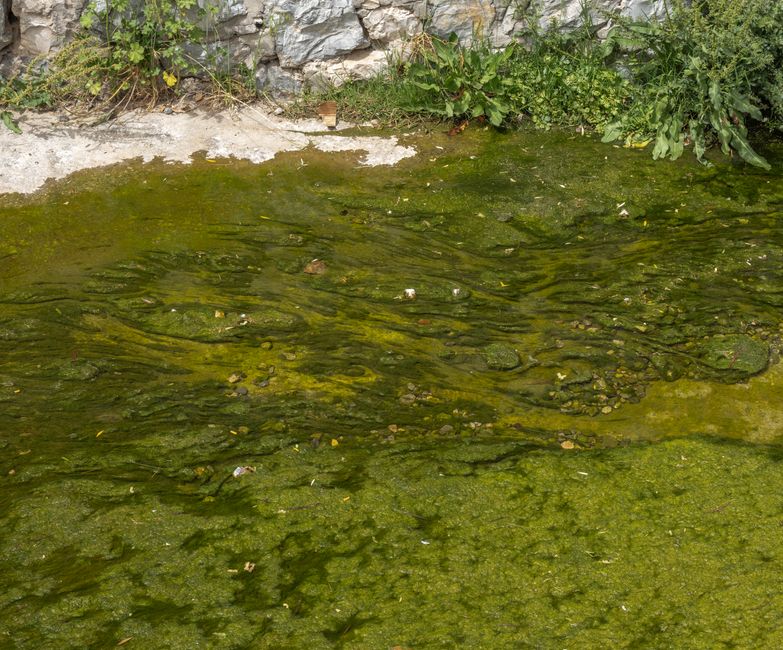
Trophic State Explained: Blue Lakes vs Pea-Green Lakes
What oligotrophic, mesotrophic, eutrophic, and hypereutrophic mean, how the Carlson Trophic State Index works, and what each means for recreation.
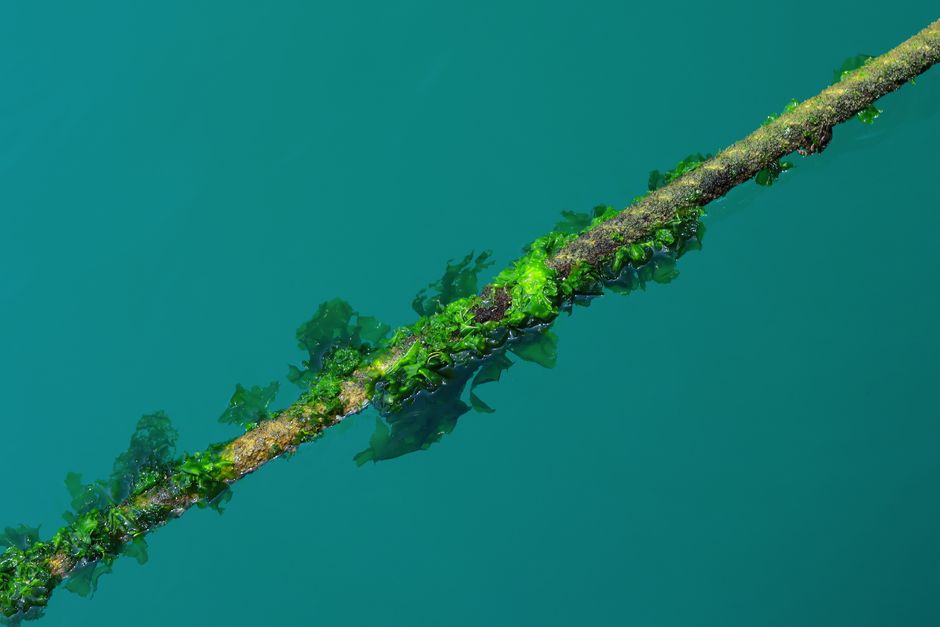
Why Lakes Turn Green: Phosphorus and Nutrient Pollution
How phosphorus and nutrient runoff drive algae growth and turn lakes green, where the nutrients come from, and what it means for a lake’s readings.
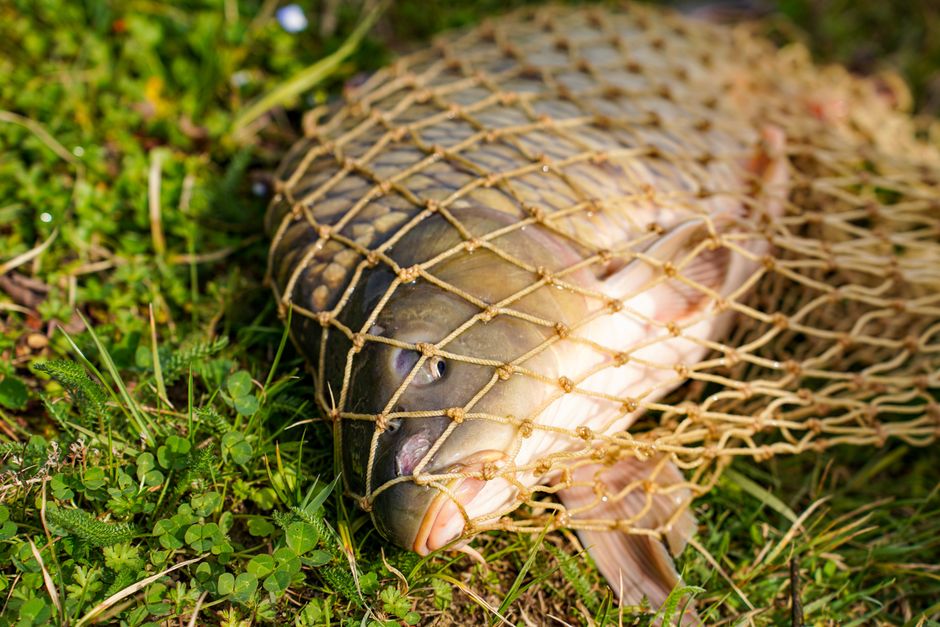
Mercury, PFAS, and the Fish You Shouldn't Eat
Why states issue fish-consumption advisories, which contaminants — mercury, PCBs, PFAS — drive them, and how to eat the fish you catch more safely.
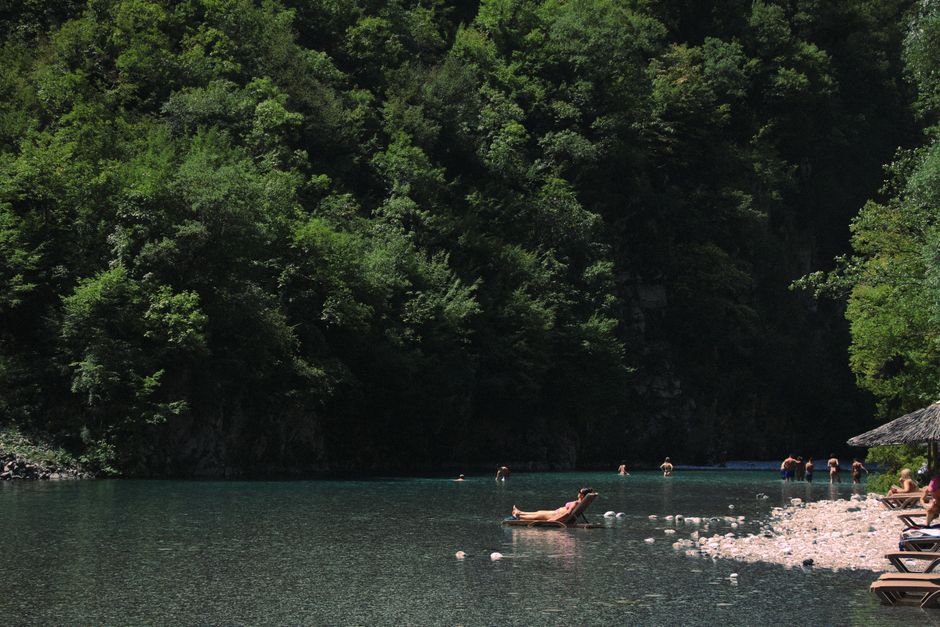
Is It Safe to Swim in a Lake? E. coli and Advisories
What a swim advisory actually means, how E. coli monitoring works, how fast a lake clears after rain, and why a long-term reading is not a swim guide.
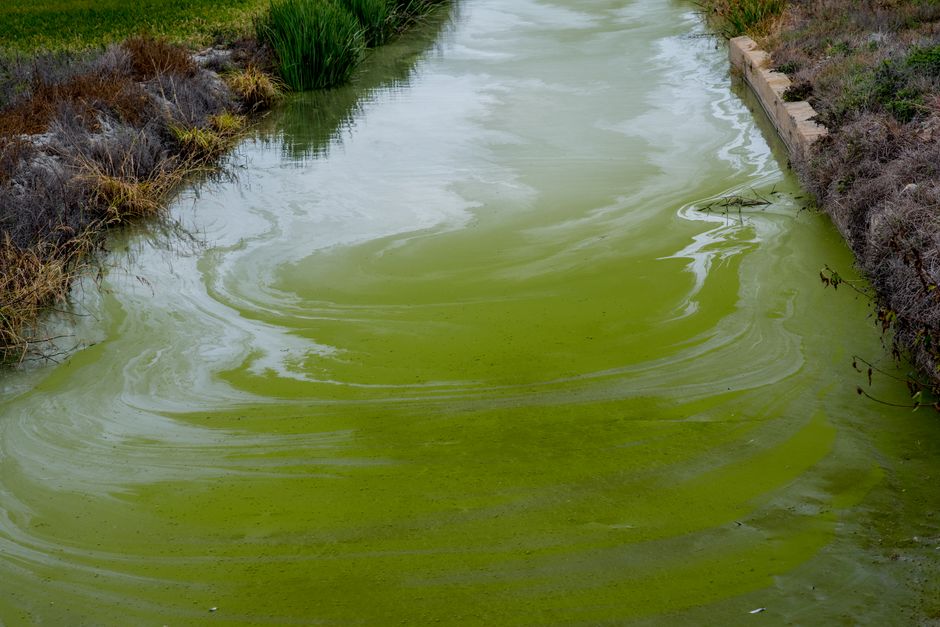
Algae Blooms Explained: When Green Water Is Dangerous
How to tell a harmless algae bloom from toxic blue-green algae, what cyanobacteria look like up close, the risk to people and dogs, and where to check.
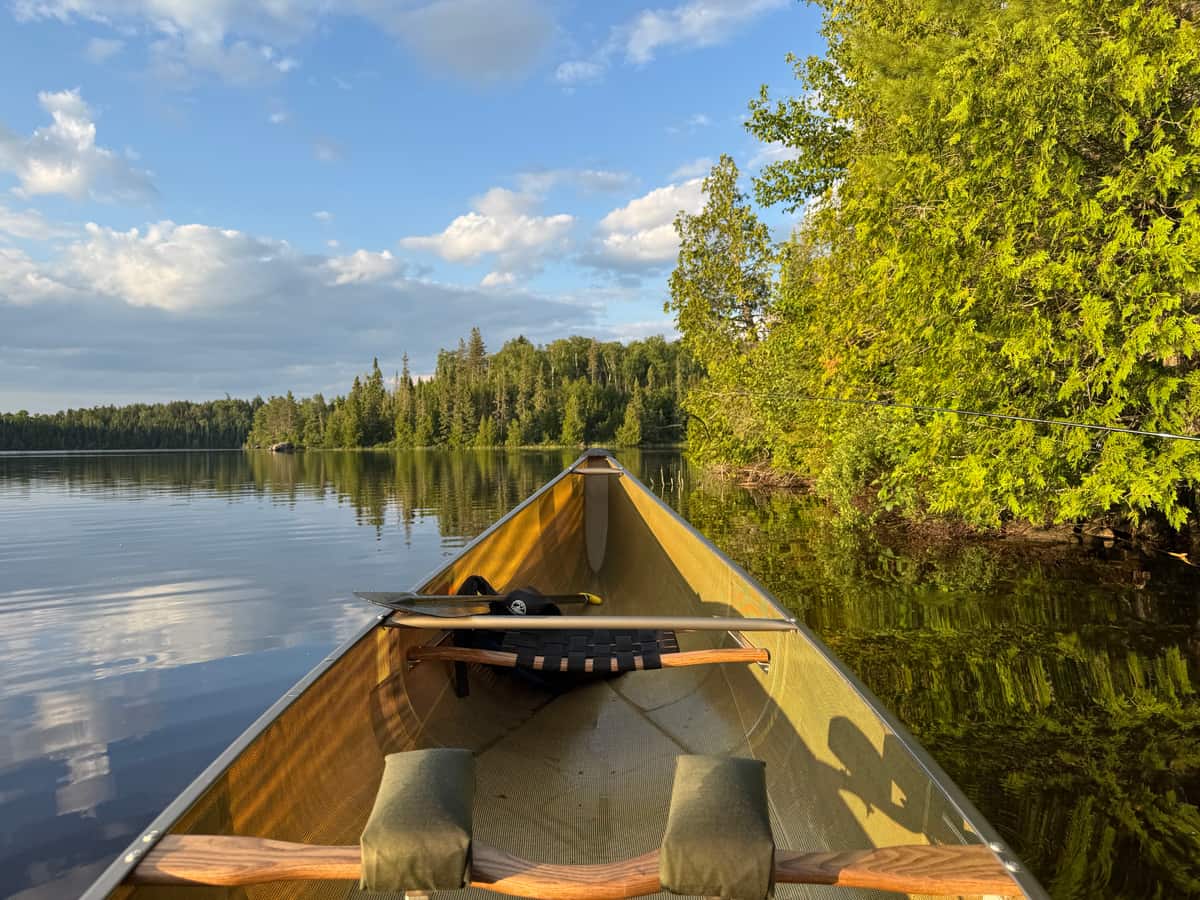
Water Clarity Explained: What Secchi Depth Tells You
What a Secchi depth reading measures, how many feet counts as good clarity, and why clear water is not always clean — with readings from measured lakes.
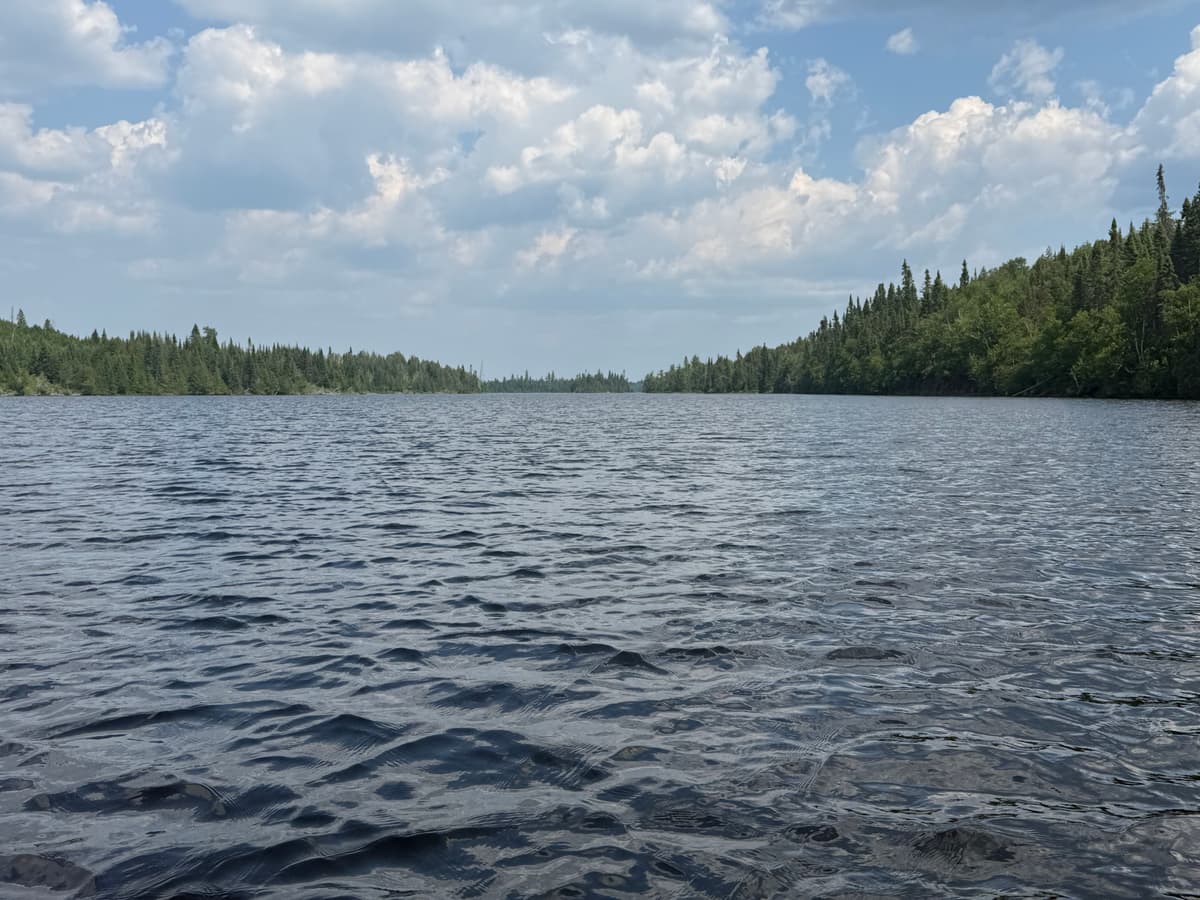
Lake Water Quality Explained: What the Readings Mean
How nutrient and algae readings are read against EPA ecoregion condition classes, what each class means in the water, and why a clean reading is not a clearance.
How These Articles Are Researched
Every reading, ranking, and trend in these articles links back to a public dataset. Water quality measurements come from the EPA Water Quality Portal. Fisheries data comes from Wisconsin DNR survey reports. Lake physical attributes come from the Minnesota DNR LakeFinder. Read the full LakeQuality methodology for how the measurements are matched to each lake, how the readings are classified, and how often the data is updated.
Frequently Asked Questions
How are these articles researched?
Each article draws on the same measurements as the rest of the site: EPA Water Quality Portal monitoring records, Minnesota Pollution Control Agency lake reports, Wisconsin Department of Natural Resources lake reports and fisheries surveys, U.S. Geological Survey records, and Minnesota DNR LakeFinder lake attributes. Nothing is estimated or modeled — every figure traces back to a public dataset you can download yourself. Last updated August 2026.
Which states does LakeQuality cover?
LakeQuality covers United States (49 states), Canada (Ontario, Québec, Nova Scotia, British Columbia and Newfoundland and Labrador), and 38 other country hubs., plus lakes in 38 other countries. Minnesota and Wisconsin carry the deepest supplemental datasets — lake depth, fish surveys, and Minnesota ice-out records — because the Minnesota Pollution Control Agency and the Wisconsin DNR run two of the richest public lake monitoring programs in the country. The articles draw on the whole dataset, and lean on the Minnesota and Wisconsin depth and survey records where a question demands those extra attributes.
How often is the data updated?
EPA Water Quality Portal records are updated as state agencies upload new monitoring data, most commonly every 6 to 12 months. Every reading and ranking on the site is recalculated whenever new data arrives. The data behind these articles was last updated August 2026.
Are these readings a substitute for current swim safety advisories?
No. The readings reflect long-term summer-season water quality. Day-of conditions can change quickly — a heavy rain can flush sediment and bacteria into a lake, and warm calm weather can trigger localized cyanobacteria (blue-green algae) blooms even in lakes whose long-term readings are the cleanest. Always check the Minnesota Department of Health's current advisory list and the Wisconsin Department of Natural Resources' beach advisory page before swimming, especially with young children, pregnant family members, or pets.
Where can I get the underlying data myself?
Every dataset cited here is publicly available. The EPA Water Quality Portal at waterqualitydata.us provides direct download access to all monitoring records. The Minnesota DNR LakeFinder publishes lake physical attributes. The Wisconsin DNR publishes fisheries survey reports through its lake records portal. Each article ends with a citations block listing the specific data source for that piece.
Sources: EPA Water Quality Portal (aggregating monitoring agencies in every covered state), Minnesota Pollution Control Agency, Wisconsin DNR Fisheries, U.S. Geological Survey, EPA STORET, Minnesota DNR LakeFinder. All data is government public domain. Cite as: "LakeQuality, August 2026 reading. Data: EPA Water Quality Portal (all covered states)."
Last updated 2026-08-26 · 30 articles published.