Published June 9, 2026
Trophic State Explained: Blue Lakes vs Pea-Green Lakes
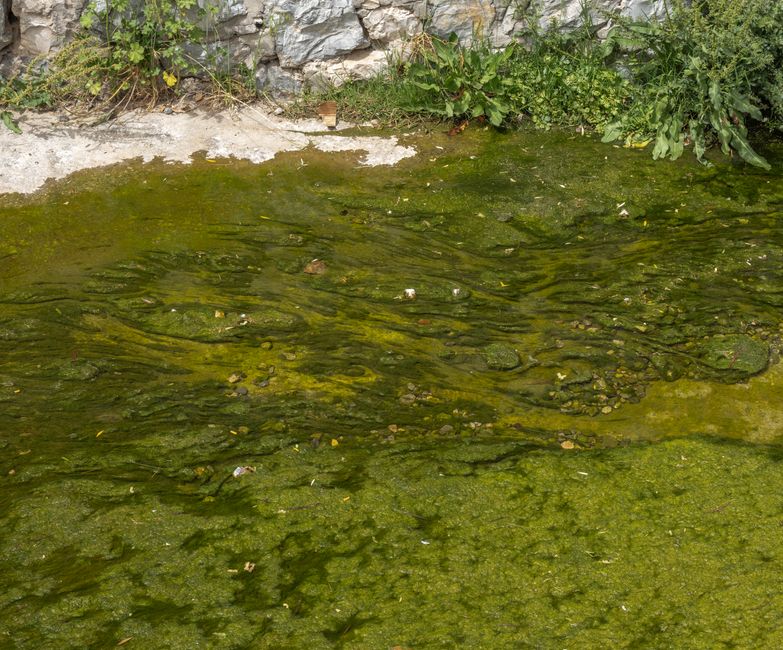
Trophic state describes a lake's biological productivity — from clear, nutrient-poor oligotrophic water to green, nutrient-rich hypereutrophic water — and it underpins the readings every lake carries.
The four trophic states
Limnologists sort lakes into four trophic states along a single gradient of nutrient richness and biological productivity. Oligotrophic lakes are the clearest and least productive; each step up adds nutrients, algae, and green color, ending at hypereutrophic. Here is what each state means, with a few lakes from our dataset that currently fall into it:
Oligotrophic
Low nutrients, clear water, excellent for swimming.
| Lake | State | TSI | Clarity (ft) |
|---|---|---|---|
| Rainy Lake | MN | 38 | 13.9 |
| East Fox Lake | MN | 38 | 16.4 |
| Deep Portage Lake | MN | 36 | 15.4 |
| Clearwater Lake | MN | 29 | 29 |
Mesotrophic
Moderate nutrients, good water quality.
| Lake | State | TSI | Clarity (ft) |
|---|---|---|---|
| Crane Lake | MN | 46 | 9 |
| Lobster Lake | MN | 44 | 13 |
| Clearwater Lake | MN | 47 | 9.8 |
| Clearwater Lake | MN | 41 | 13 |
Eutrophic
High nutrients, frequent algae, reduced clarity.
| Lake | State | TSI | Clarity (ft) |
|---|---|---|---|
| South Sturgeon Lake | MN | 53 | 2.5 |
| Schram Lake | MN | 51 | 3.9 |
| Colby Lake | MN | 51 | 3 |
| Jessie Lake | MN | 50 | 4.6 |
Hypereutrophic
Very high nutrients, dense algae, poor clarity.
| Lake | State | TSI | Clarity (ft) |
|---|---|---|---|
| Merritt Reservoir | NE | 73 | 2 |
| Pelican Lake | NE | 77 | 1.2 |
| Smith Lake | NE | 75 | 1.7 |
| Crescent Lake | NE | 77 | 0.8 |
The Carlson Trophic State Index (TSI)
The Carlson Trophic State Index is a 0–100 scale that condenses a lake's productivity into one comparable number. Introduced by Robert Carlson in 1977, its usefulness is that it can be computed from any one of three routine measurements — Secchi depth (water clarity), total phosphorus, or chlorophyll-a — each converted onto the same scale, so lakes measured different ways can still be compared. As a rough guide, a TSI below 40 is oligotrophic, 40 to 50 mesotrophic, 50 to 70 eutrophic, and above 70 hypereutrophic.
TSI and the EPA condition classes are related but not the same scale. The class is an ecoregion-referenced nutrient-and-algae finding (phosphorus, nitrogen, chlorophyll-a, turbidity). TSI can be computed from Secchi alone, which is why it still appears on some unrated lakes — and why this site only states a trophic class on sampled lakes. A low-TSI, oligotrophic lake tends to sit in EPA's favourable classes; a high-TSI, hypereutrophic lake in its poorer ones. That is a tendency, not an identity. Our methodology and the trophic state guide show exactly how the numbers translate.
What each state means for swimming and fishing
Trophic state is not a verdict of "good" or "bad" — it describes what kind of lake you are dealing with, and different uses favor different states. Oligotrophic and mesotrophic lakes offer the clear water swimmers and paddlers want, and their cold, oxygen-rich depths suit coldwater fish like trout and cisco. Eutrophic lakes trade clarity for productivity: more nutrients feed more of the food web, which can mean excellent warm-water fishing for bass, walleye, and panfish even as summer algae reduce visibility. Hypereutrophic lakes, dense with algae and prone to low-oxygen conditions, are the least suited to swimming and can experience fish kills and harmful blue-green blooms.
Natural versus accelerated eutrophication
Every lake becomes more productive over time — this is natural eutrophication, and left alone it plays out over centuries or millennia as sediment and nutrients slowly accumulate. The problem is accelerated (cultural) eutrophication, in which human nutrient inputs compress that timeline from centuries into decades or even years. The driver is almost always excess phosphorus from fertilizer, manure, failing septic systems, and stormwater. Our companion explainer, why lakes turn green, traces exactly how that nutrient loading pushes a lake up the trophic scale — and why cutting the phosphorus supply is the lever that can slow or reverse it.
Frequently Asked Questions
Trophic state describes how biologically productive a lake is — essentially, how much algae and plant growth it supports. It runs from oligotrophic (low nutrients, clear water) through mesotrophic and eutrophic to hypereutrophic (very high nutrients, dense algae). It is a measure of nutrient richness, not of whether a lake is "good" or "bad," though higher trophic states generally mean lower clarity and poorer swimming.
The Carlson Trophic State Index, published by Robert Carlson in 1977, is a 0–100 scale that puts a lake's productivity into a single number. It can be calculated from any of three measurements — Secchi depth (clarity), total phosphorus, or chlorophyll-a — that are converted to the same scale. Roughly, TSI under 40 is oligotrophic, 40–50 mesotrophic, 50–70 eutrophic, and above 70 hypereutrophic.
For swimming and clarity, yes — oligotrophic lakes are clear and low in algae. But eutrophic lakes are more productive and often support larger warm-water fish populations, so anglers may prefer them. Trophic state describes what a lake is, not a grade of quality; the concern is when a lake becomes more eutrophic faster than it naturally would because of nutrient pollution.
Yes. Lakes naturally become more productive over centuries as sediment and nutrients accumulate. But nutrient pollution from fertilizer, septic systems, and stormwater can accelerate that shift from decades to years — a process called cultural or accelerated eutrophication. Reducing nutrient inputs can, over time, move a lake back toward a lower trophic state.
/methodology
Related Articles
Get lake water-quality guides by email
New explainers on trophic state, algae, and lake health as we publish. No spam, unsubscribe anytime.