Published June 16, 2026 · Updated August 18, 2026
The State of America's Lakes 2026
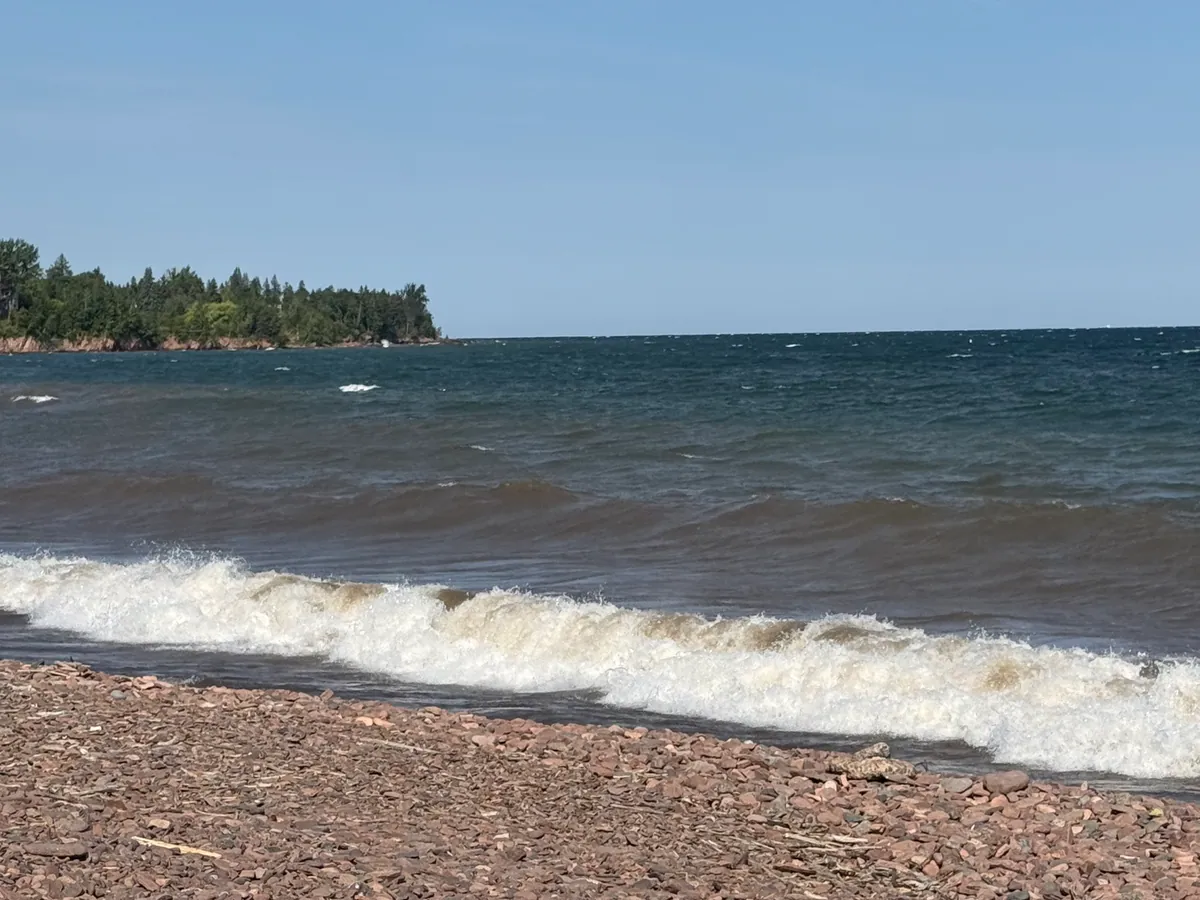
As of September 3, 2026, LakeQuality tracks 37,603 lakes. Every page reports the measurements its agency published. Ontario and Québec lakes carry provincial measurements. Of those sampled lakes, 50.4% sit in EPA's favourable condition classes, and 31.5% in its poorer ones. 32,858 have no nutrient reading. Snapshot from EPA Water Quality Portal samples read against National Lakes Assessment ecoregion classes. The live US state-by-state edition is the State of America’s Lakes data report.
The 2026 range of readings
Lake water quality in the United States is not evenly distributed. Phosphorus, nitrogen, chlorophyll-a and turbidity are read against EPA National Lakes Assessment 2022 ecoregion condition classes. Secchi depth is measured and shown because it is what you see; EPA assigns it no condition class. Shares below are of the 5,873 sampled lakes. 32,858 more lakes in the file have no nutrient reading: EPA Integrated Reporting Category 3, not a poor one.
| Meaning | Lakes | Share |
|---|---|---|
| Measured | 1,192 | 20.3% |
| Measured | 1,766 | 30.1% |
| Measured | 1,064 | 18.1% |
| Measured | 1,197 | 20.4% |
| Measured | 654 | 11.1% |
The middle of the distribution tells the real story. A large block of lakes sits mid-range, with moderate algae during warm months, water that is generally safe but visibly greener than a pristine northern lake. The tails matter too: the lowest-nutrient lakes are clear enough to see the bottom in many areas, while the most nutrient-rich can have visibility under three feet and recurring blooms.
Water quality state by state
The cleanest lakes cluster where the geology and land use favor them. Deep, cold, forested watersheds in the northern states hold clarity; shallow lakes ringed by row-crop agriculture carry the phosphorus loads that turn water green. The table below ranks the states we cover by their average nutrient and algae readings.
| State | Lakes |
|---|---|
| Michigan | 3,392 |
| Vermont | 308 |
| New York | 1,613 |
| Wisconsin | 3,133 |
| Wyoming | 731 |
| Minnesota | 6,760 |
| Florida | 3,122 |
| Virginia | 390 |
| Massachusetts | 829 |
| Montana | 865 |
| Utah | 304 |
| South Dakota | 469 |
| Alabama | 422 |
| Georgia | 693 |
| Arizona | 229 |
| Kentucky | 189 |
| Colorado | 733 |
| Idaho | 301 |
| New Mexico | 326 |
| Missouri | 451 |
| Indiana | 387 |
| North Dakota | 826 |
| Nebraska | 592 |
| Nevada | 223 |
| Washington | 792 |
| Pennsylvania | 570 |
| Oregon | 659 |
| Tennessee | 277 |
| North Carolina | 395 |
| Texas | 1,376 |
| Arkansas | 632 |
| Kansas | 239 |
| Ohio | 292 |
| Oklahoma | 319 |
| Illinois | 594 |
| Iowa | 330 |
On this measure, Michigan posts the lowest average nutrient and algae readings. Read state averages as a reflection of the underlying landscape, not a summary on any one agency: a state of shallow prairie lakes will always average greener than a state of deep glacial ones, no matter how well either is managed.
Averages also hide range. Every state on the list has clear, low-nutrient lakes and impaired ones, sometimes within a few miles of each other. To see where a specific lake falls, open its state page or the national cleanest-lakes ranking.
What is improving, and what is slipping
Water quality changes slowly. We flag a trend only where a lake has several years of repeated sampling, then look at the direction of its clarity, phosphorus, and chlorophyll-a over time. Of the 7,207 lakes with enough history to call, 2,784 are improving and 2,864 are declining. The rest are holding steady.
Improvements usually trace back to fewer nutrients reaching the water: upgraded wastewater treatment upstream, shoreline buffers that catch runoff, and agricultural practices that keep phosphorus on the field. Declines run the other way — new development, intensifying farm runoff, invasive species, and warmer summers that lengthen the algae season. The two stories are covered in depth in the comeback lakes and the lakes where quality is slipping.
How these readings are classified
Every number here is computed from public monitoring data, not estimates. Letters follow EPA National Lakes Assessment condition classes for phosphorus, nitrogen, chlorophyll-a, and turbidity, keyed to each lake's ecoregion. Secchi clarity is measured and shown separately. A condition class is a nutrient-and-algae statement, not a swim clearance. Full detail is on the methodology page and in Lake Water Quality Explained.
Two caveats apply to any national read. First, data density varies by state, so a state average built on a few hundred lakes carries more uncertainty than one built on thousands. Second, a reading is a long-term water-quality signal, not a day-of forecast — a clean lake can still have a temporary bloom after a warm, calm spell. For same-day risk, always check your state's beach notices and the algae advisories page before you swim.
Frequently Asked Questions
As of September 3, 2026, LakeQuality tracks 37,603 lakes. Every page reports the measurements its agency published. Ontario and Québec lakes carry provincial measurements. Readings are compared with EPA National Lakes Assessment ecoregion condition classes for phosphorus, nitrogen, chlorophyll-a, and turbidity. Secchi clarity is shown, not scored. 32,858 lakes have no nutrient reading rather than a guessed one.
Of the 5,873 rated lakes, about 50.4% sit in EPA’s Good condition class for nutrients and algae in their ecoregion. Roughly 31.5% sit in EPA's poorer classes. 32,858 more lakes carry no nutrient reading; that is insufficient evidence, not a poor one.
Among the states we cover, Michigan has the lowest average nutrient and algae readings across its 3,392 lakes. State averages reflect geology, lake depth, and surrounding land use as much as any single management program.
Of the 7,207 lakes with enough multi-year data to detect a trend, 2,784 are improving and 2,864 are declining. Most lakes with long records are holding steady — water quality changes slowly, over years, not weeks.
Monitoring density varies widely. States with long-running volunteer and agency programs (such as Minnesota and Wisconsin) sample thousands of lakes repeatedly, while others report fewer lakes sampled once or twice. Averages from thinly sampled states should be read with that caveat.
/methodology
Related Articles
Get the annual State of America's Lakes by email
Fresh water-quality data and rankings as we publish them. No spam, unsubscribe anytime.