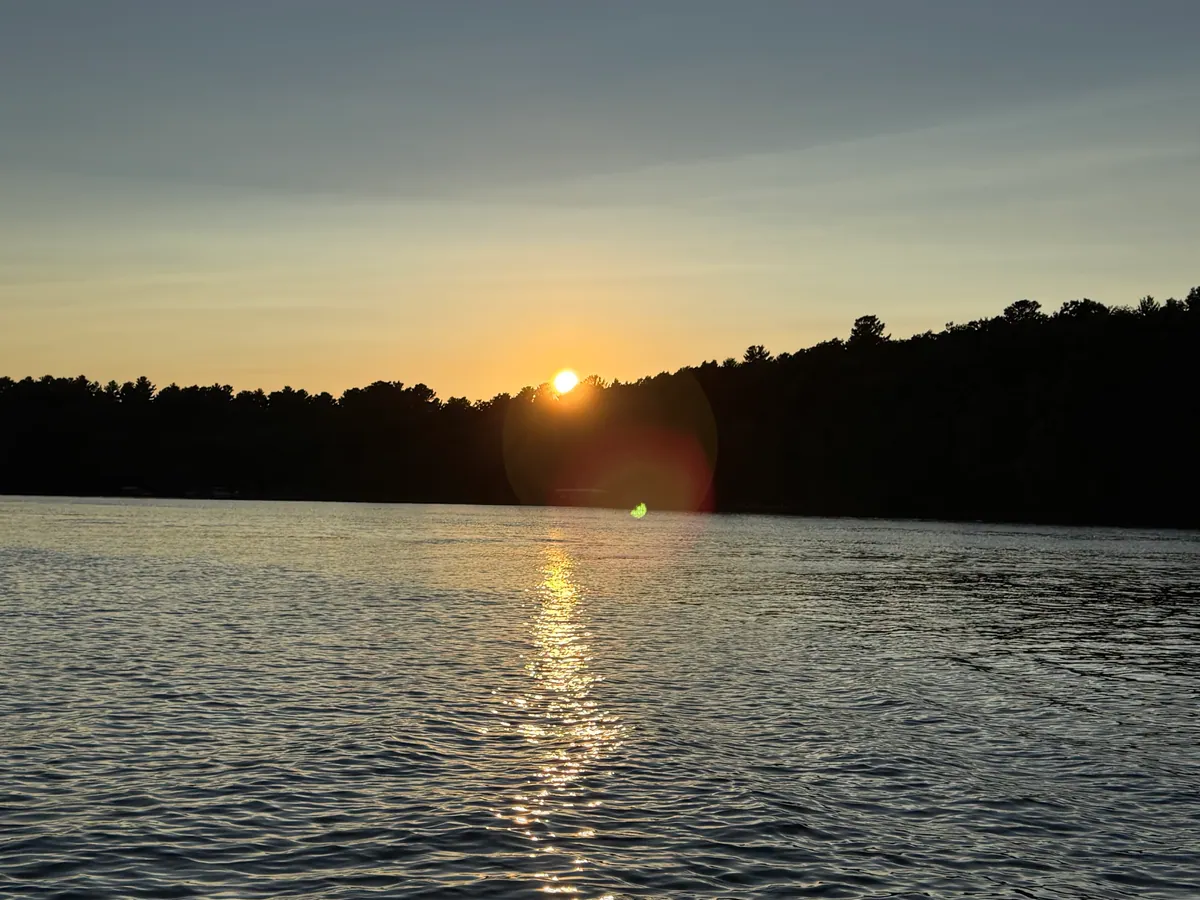
Horseshoe Lake vs Upper Mission Lake
Water quality, depth, fish species, and recreation comparison.
Horseshoe Lake and Upper Mission Lake read the same on nutrients and algae. Both are in Crow Wing County, Minnesota.
Both Horseshoe Lake and Upper Mission Lake sit in Minnesota. A same-state comparison strips out the state-level water-quality regime as a variable: any differences in the readings here are about the lakes themselves, not the agencies sampling them. These two sit close on the readings, Horseshoe Lake versus Upper Mission Lake. The deciding factors for a recreational visitor are likely physical (depth, access, fish species) rather than water-quality differences.
With readings this close, the choice between the two lakes turns on non-water-quality factors: depth, fish species, public access, distance from home. The per-lake pages below cover all of those.
Horseshoe Lake
Good clarity, visible to about 14.4 ft.
Upper Mission Lake
Good clarity, visible to about 11 ft.
Side-by-Side Metrics
| Metric | Horseshoe Lake | Upper Mission Lake |
|---|---|---|
| Water Clarity | 14.4 ft Better | 11 ft |
| Phosphorus | 11 µg/L Better | 15.5 µg/L |
| Chlorophyll-a (Algae) | 3.5 µg/L Better | 5.1 µg/L |
| Maximum Depth | 56 ft Better | 36 ft |
| Surface Area | 922 acres | 882 acres |
| Public Access | Yes | Yes |
| Fish Species | 11 | 13 Better |
| Trophic State | mesotrophic | mesotrophic |
A green ✓ marks the better value for that metric (lower phosphorus / chlorophyll = cleaner; higher Secchi / depth / species count = better). Surface area and trophic state carry no tick — a bigger lake is not a better lake.
Swap a lake
Compare Horseshoe Lake or Upper Mission Lake against a different lake.
Verdict
Both lakes earn the same Grade A. The tiebreakers come down to clarity (Horseshoe Lake: 14.4 ft, Upper Mission Lake: 11 ft) and what you want from the lake. Horseshoe Lake has fewer fish species than Upper Mission Lake.
Source: EPA National Aquatic Resource Surveys, 2026.