Published August 23, 2026 · Updated August 23, 2026
Impaired Lakes Explained: What an EPA Listing Means
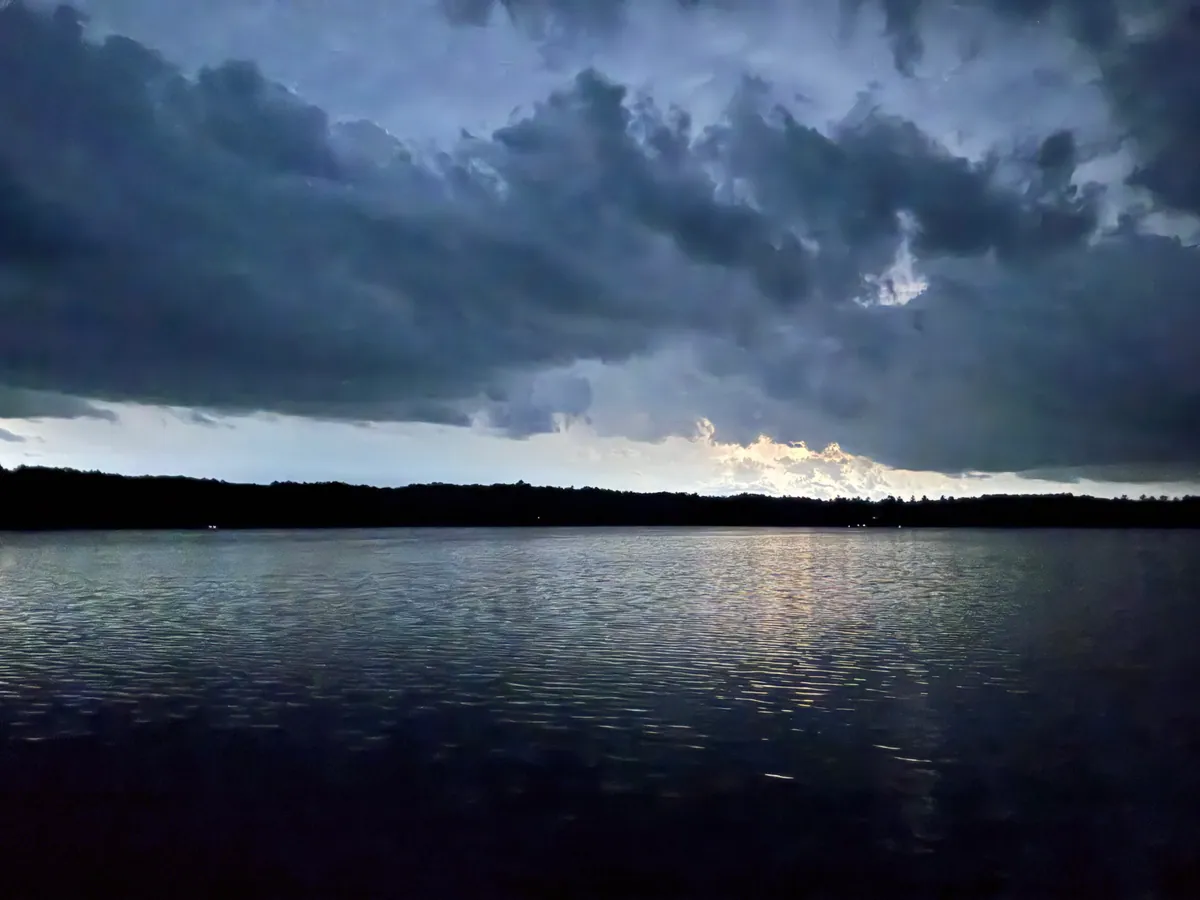
“Impaired” sounds like a verdict on the water. Usually it is a verdict on the fish. Mercury is the single most common reason a lake gets listed — 2,758 of 6,089 listed lakes here — and 74% of the lakes listed for mercury alone still sit in EPA's favourable condition classes on nutrients and algae.
How many lakes are listed
Of 33,763 lakes matched against the EPA's ATTAINS assessment database across 35 states, 6,089 carry at least one impairment listing — 18%. Lakes that have not been through that match are excluded from the figure entirely; a lake nobody has assessed is unknown, not clean, and folding it in would push the rate down for no reason but silence.
A listing is not a single label. Listed lakes average 1.6 distinct causes each, and the mix is the part that decides what it means for you.
What lakes are listed for
| Listed cause | Lakes | Share of listed | Reaches you through |
|---|---|---|---|
| Mercury | 2,758 | 45% | Eating the fish you catch |
| Nutrients (phosphorus, nitrogen) | 2,236 | 37% | Green water, algae, clarity |
| Algal growth | 930 | 15% | Green water, possible toxin advisories |
| Oxygen depletion (low DO) | 586 | 10% | Fish kills and habitat |
| pH / acidity | 544 | 9% | Aquatic life and habitat |
| Impaired biota (cause unknown) | 398 | 7% | Aquatic life and habitat |
| PCBs | 320 | 5% | Eating the fish you catch |
| Nuisance exotic species | 306 | 5% | Boating, habitat, shoreline use |
| Turbidity | 276 | 5% | Water clarity |
| Metals (other than mercury) | 215 | 4% | Aquatic life, sometimes fish consumption |
The top two behave completely differently. Nutrient and algae listings describe the water you would swim in and are the same signals behind the nutrient and algae numbers, which is why they and the condition class usually agree. Mercury describes the tissue of a walleye that has spent eight years eating smaller fish, and it has almost nothing to do with how the water looks.
Why an impaired lake can still be clear
1,710 lakes here are listed for mercury and nothing else. Among those with a full grade, the distribution is not what the word “impaired” suggests:
| Listed for mercury only | Share | All listed lakes |
|---|---|---|
| 297 | 51.7% | 19.1% |
| 131 | 22.8% | 21.3% |
| 99 | 17.2% | 18.1% |
| 36 | 6.3% | 24.9% |
| 12 | 2.1% | 16.6% |
Mercury arrives from the atmosphere, mostly from combustion, and settles across whole regions rather than on individual shorelines. Lake bacteria convert it to methylmercury, which concentrates as it moves up the food chain, so the longest-lived predators carry the most. A remote lake with an undeveloped forested shore is exactly the kind of place that gets a mercury listing and a low nutrient reading in the same year. What to do about it is in Mercury, PFAS, and the Fish You Shouldn't Eat.
The clearest low-nutrient lakes here that carry a mercury-only listing:
| Lake | State | Clarity (ft) |
|---|---|---|
| Serpent Lake | Minnesota | 25 |
| Big Cormorant Lake | Minnesota | 24.8 |
| Big Sand Lake | Minnesota | 23 |
| Stony Lake | Minnesota | 23 |
| Belle Taine Lake | Minnesota | 22.8 |
| Eagle Lake | Minnesota | 22.6 |
| West Sylvia Lake | Minnesota | 22 |
| East Sylvia Lake | Minnesota | 21 |
Where listings concentrate
Listing rates say as much about how thoroughly a state assesses its water as about the water itself. A state that samples aggressively finds more to list; a state that assesses a fraction of its lakes reports a smaller number and a cleaner-looking one. Read the column of assessed lakes next to the column of listed ones.
| State | Lakes assessed | Listed | Share listed |
|---|---|---|---|
| Minnesota | 6,760 | 1,614 | 24% |
| Florida | 3,122 | 878 | 28% |
| New York | 1,613 | 399 | 25% |
| Massachusetts | 829 | 389 | 47% |
| Wisconsin | 3,133 | 388 | 12% |
| Michigan | 3,392 | 383 | 11% |
| Illinois | 594 | 242 | 41% |
| Washington | 792 | 153 | 19% |
| Missouri | 451 | 132 | 29% |
| Kansas | 239 | 130 | 54% |
| Oregon | 659 | 125 | 19% |
| Iowa | 330 | 122 | 37% |
What a listing should change about your day
Read the cause, not the word. A nutrient or algae listing is a reason to check the current advisory before swimming and to expect green water in late summer; that mechanism is in Why Lakes Turn Green. A bacteria listing is about contact after rain, covered in Is It Safe to Swim in a Lake? A mercury or PCB listing is a reason to follow the state's fish-consumption guidance and no reason at all to skip the swim.
One more thing worth knowing: 3,259 of these lakes already have a cleanup budget written for them. Listings are the mechanism that starts that work, which is why a lake appearing on the list is a step in the process rather than the end of the story. The lakes where it has demonstrably worked are in Lakes Making a Water-Quality Comeback.
Frequently Asked Questions
It means the state assessed that water against the uses it is supposed to support — swimming, fishing, drinking water supply, aquatic life — and found at least one of them not being met. The listing is a legal and regulatory status under the Clean Water Act. It is a statement about one specific failing measurement, not a verdict that the whole lake is dirty.
Usually not. Of 6,089 listed lakes here, 1,710 are listed for mercury and nothing else, and mercury is a fish-tissue problem rather than a contact problem. Swimming advisories come from bacteria or algae toxins, which are separate listings and are posted locally when they apply.
Because most of it arrives from the air rather than from a pipe. Mercury from coal combustion and industry travels long distances, settles on the watershed, and is converted by lake bacteria into methylmercury, which builds up through the food chain into large predatory fish. A remote forest lake with nothing built on its shore can be listed for it.
Routinely. Among lakes listed only for mercury that also carry nutrient and algae readings, 74% sit in EPA’s favourable condition classes for nutrients and algae and 297 of them sit in the Good class. The listing is about what is in the fish, not about what the water looks like.
Section 303(d) of the Clean Water Act requires every state to publish the waters that are not meeting their standards; 3,521 of the listed lakes here appear on it. A TMDL — Total Maximum Daily Load — is the pollution budget written afterwards to bring one back into compliance. 3,259 of these lakes have one, which means a cleanup plan exists on paper.
States report on a two-year cycle, so a listing can reflect sampling from several years before it was published, and a lake that has improved may stay listed until the next assessment cycle catches up. The reporting cycle is shown on each lake page for that reason.
/methodology
Related Articles
Get lake water-quality explainers by email
New readings, advisories and analysis as we publish. No spam, unsubscribe anytime.