Published August 23, 2026 · Updated August 23, 2026
Are Reservoirs Cleaner Than Natural Lakes?
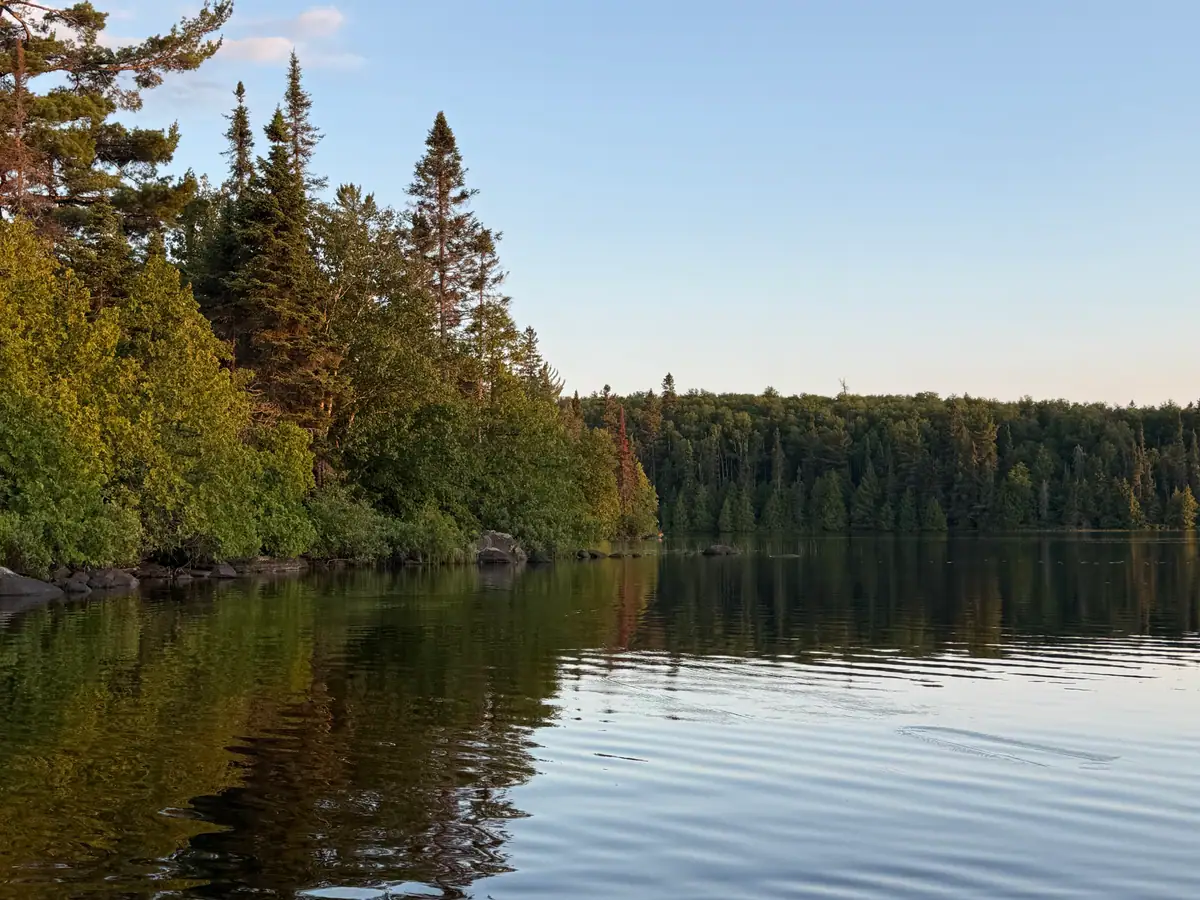
No. Across 5,873 measured lakes checked against the national dam inventory, 56% of natural lakes sit in EPA’s favourable condition classes for nutrients and algae, against 34% of dam-built reservoirs. The reservoirs that do read clean are the interesting part: 298 of them sit in the Good class.
The two groups, measured the same way
Every lake here is read on the same four measurements — total phosphorus, total nitrogen, chlorophyll-a, and turbidity — against the norms for its ecoregion. Water clarity is shown on each page but is not one of them. Nothing in the readings knows whether a dam is involved. The split below comes from matching each lake against the National Inventory of Dams: a lake with a co-located dam is counted as a reservoir, and a lake that was searched for and came back with no dam is counted as natural. Lakes that have not been through that match yet appear in neither column — a lake nobody has checked is unknown, not natural.
| Reservoirs | % of reservoirs | Natural lakes | % of natural | |
|---|---|---|---|---|
| 298 | 19.3% | 894 | 20.6% | |
| 225 | 14.6% | 1,541 | 35.6% | |
| 349 | 22.6% | 715 | 16.5% | |
| 378 | 24.5% | 819 | 18.9% | |
| 293 | 19.0% | 361 | 8.3% | |
| Favourable classes | 523 | 33.9% | 2,435 | 56.2% |
Lakes without readings are excluded from both columns rather than counted as failures: an unmeasured lake is unknown, not a poor one. How a reading is classified is in Lake Water Quality Explained.
Why the gap exists
A reservoir is a river with a wall across it, so it inherits the river's watershed. Every acre upstream drains through it: cropland, pasture, stormwater, treated effluent. A natural lake in a closed basin may collect runoff from a few square miles; an impoundment can collect it from thousands. That is the largest single difference between the two columns, and it is a difference in what the water receives rather than in what the dam does.
Shape compounds it. Impoundments tend to be broad and shallow for their surface area, which keeps nutrient-rich bottom sediment inside the sunlit layer where algae can use it, and lets wind re-suspend it. Deep, steep-sided natural basins stratify in summer and hold their phosphorus below the thermocline instead. That mechanism is the subject of Do Deeper Lakes Have Better Water Quality?, and the nutrient side of it is in Why Lakes Turn Green.
There is also a siting effect that no amount of care can remove from this table. Dams get built where rivers, farms, and towns already are. The reservoir column is therefore partly a land-use column, and the honest reading is that impounded water tends to sit in harder places — not that impounding water is what ruined it.
What reservoirs are built for
The dam records carry a primary purpose, and it is not mostly flood control. Of the 2,259 matched reservoirs with a stated primary purpose, recreation is the largest single category — these are water bodies built to be used.
| Primary purpose | Reservoirs | Share |
|---|---|---|
| Recreation | 1,106 | 49% |
| Flood Risk Reduction | 348 | 15% |
| Water Supply | 341 | 15% |
| Irrigation | 216 | 10% |
| Hydroelectric | 147 | 7% |
| Other | 101 | 4% |
Age varies enormously. The oldest dam matched in this set is Damon Pond Dam, completed in 1760, behind Damon Pond in Massachusetts. A century of accumulated sediment is a different starting point from a reservoir filled in the 1980s.
The reservoirs with the lowest nutrient readings
298 matched reservoirs read in EPA’s Good class, and 361 natural lakes read in its poorest nutrient class. Neither category is destiny. The lowest-nutrient impoundments below are typically fed by forested rather than farmed watersheds, which is the same variable doing the work in both directions.
| Reservoir | State | Clarity (ft) | Built for |
|---|---|---|---|
| Clearwater Lake | Minnesota | 10 | Other |
| Pelican Lake | Minnesota | 16.4 | Recreation |
| Pelican Lake | Minnesota | 14.3 | Other |
| Round Lake | Minnesota | 10 | Recreation |
| Washburn Lake | Minnesota | 14.1 | Recreation |
| Long Lake | Minnesota | 19.5 | Recreation |
| Long Lake | Minnesota | 11.2 | Recreation |
| Deer Lake | Minnesota | 13.1 | Recreation |
What to do with this
Do not rule out a reservoir. Rule out poor readings. The category shifts the odds and the individual lake's readings settle the question, so read the lake's own summary, its clarity trend, and any current advisory before a swim or a cabin booking. The state-by-state reservoir listings are under reservoirs by state, the cleanest measured water overall is in the cleanest ranking, and the buyer's version of this question is in What to Check Before Buying Lakefront Property.
Frequently Asked Questions
Not in this dataset. Of 1,543 measured reservoirs, 34% sit in EPA’s favourable condition classes for nutrients and algae. Of 4,330 measured natural lakes checked against the same dam inventory, 56% do — a gap of about 22 percentage points. Reservoirs are also about 2.3 times as likely to grade an F.
A reservoir sits where a river used to run, so it collects whatever the whole upstream watershed sends down it — fertilizer, eroded soil, treated wastewater. Many are shallow relative to their surface area, which keeps nutrient-rich sediment within reach of sunlight and wind. Natural lakes more often sit in closed basins with far smaller drainage areas feeding them.
Often, yes. The readings are a summary of nutrient and algae measurements over time, not a same-day clearance, and plenty of reservoirs read clean. Check the readings, then check whether your state has posted a current algae or bacteria advisory for that specific water before you get in.
Each lake is matched against the Army Corps of Engineers National Inventory of Dams. A lake with a co-located dam record is treated as a reservoir; a lake the inventory was searched for and returned nothing on is treated as natural. Lakes that have not been through that match are left out of both columns rather than assumed natural. 2,439 lakes carry a dam match, 1,543 of them with a full EPA condition class across 36 states.
No. Reservoirs are built where rivers are, which is disproportionately in farmed and settled watersheds, so land use and impoundment are tangled together in this table. What the numbers support is the practical point: the average impounded water body carries a heavier nutrient load than the average natural one, and the readings on the individual lake is what settles the individual case.
/methodology
Related Articles
Get new lake water-quality analysis by email
New readings, rankings and explainers as we publish. No spam, unsubscribe anytime.