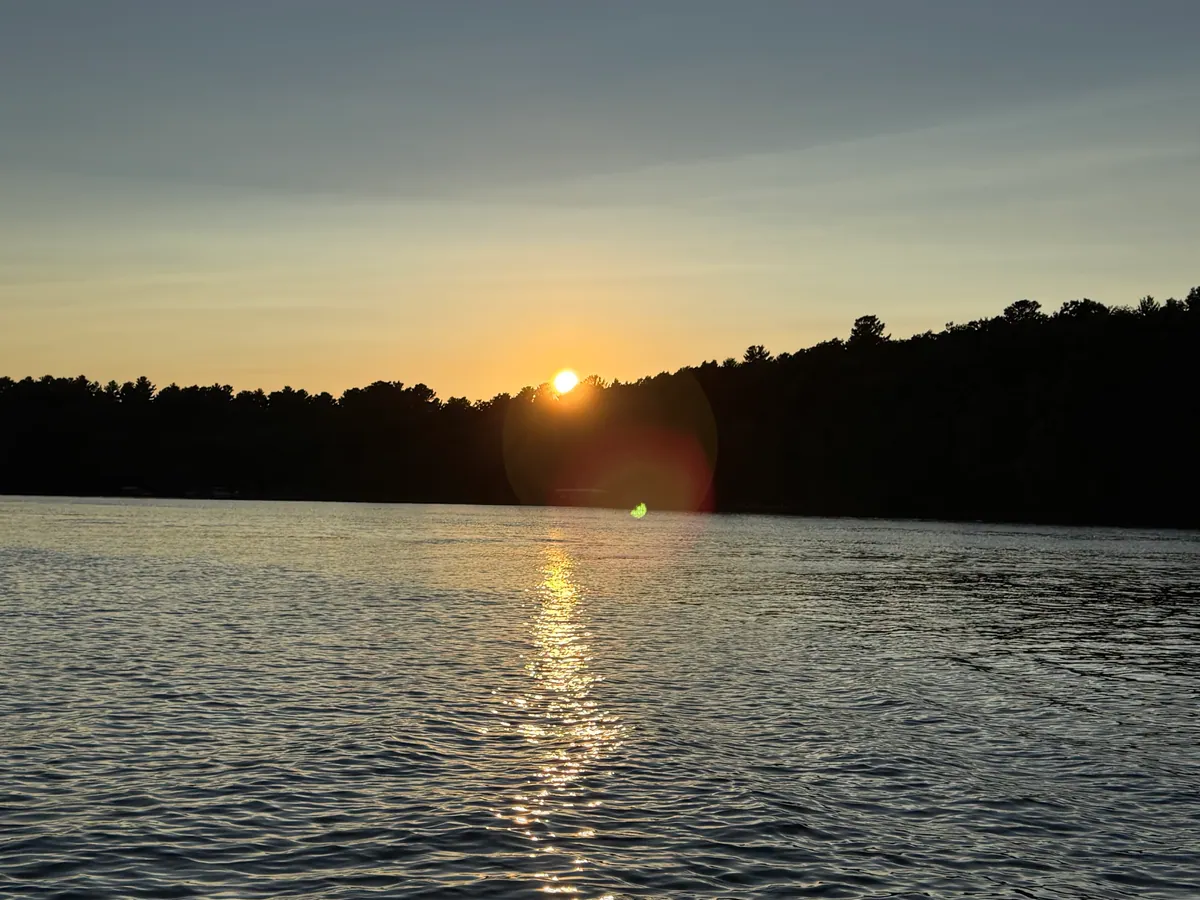
Big Lake vs Upper Estuary Lake
Water quality, depth, fish species, and recreation comparison.
Big Lake reads lower on nutrients and algae than Upper Estuary Lake. Both are in St. Louis County, Minnesota.
Big Lake and Upper Estuary Lake are both in Minnesota — a same-state head-to-head where the comparison comes down to lake-specific differences in depth, watershed, and monitoring history rather than the broader state-level water-quality regime. The readings are meaningfully apart: Big Lake carries clearly lower phosphorus and chlorophyll-a readings than Upper Estuary Lake. A spread that wide reflects real underlying differences, in watershed inputs, depth profiles, or monitoring rigor.
For a recreational visitor, the wider gap in the readings is decisive: Big Lake has the lower nutrient and algae numbers. For a researcher, the gap is the interesting part: what is different about the two watersheds, and which of those differences is mutable?
Big Lake
Moderate clarity, visible to about 8.2 ft.
Upper Estuary Lake
Very murky, less than 1.9 ft of visibility.
Side-by-Side Metrics
| Metric | Big Lake | Upper Estuary Lake |
|---|---|---|
| Water Clarity | 8.2 ft Better | 1.9 ft |
| Phosphorus | 14 µg/L Better | 49.5 µg/L |
| Chlorophyll-a (Algae) | 4.9 µg/L | 1.7 µg/L Better |
| Maximum Depth | 22 ft | 55 ft Better |
| Surface Area | 1,904 acres | 10,255 acres |
| Public Access | Yes | Yes |
| Fish Species | 8 | 33 Better |
| Trophic State | mesotrophic | eutrophic |
A green ✓ marks the better value for that metric (lower phosphorus / chlorophyll = cleaner; higher Secchi / depth / species count = better). Surface area and trophic state carry no tick — a bigger lake is not a better lake.
Swap a lake
Compare Big Lake or Upper Estuary Lake against a different lake.
Verdict
Big Lake reads lower on nutrients and algae than Upper Estuary Lake. Water clarity: 8.2 ft vs 1.9 ft. For more fish-species variety, Upper Estuary Lake edges ahead with 33 documented species.
Source: EPA National Aquatic Resource Surveys, 2026.