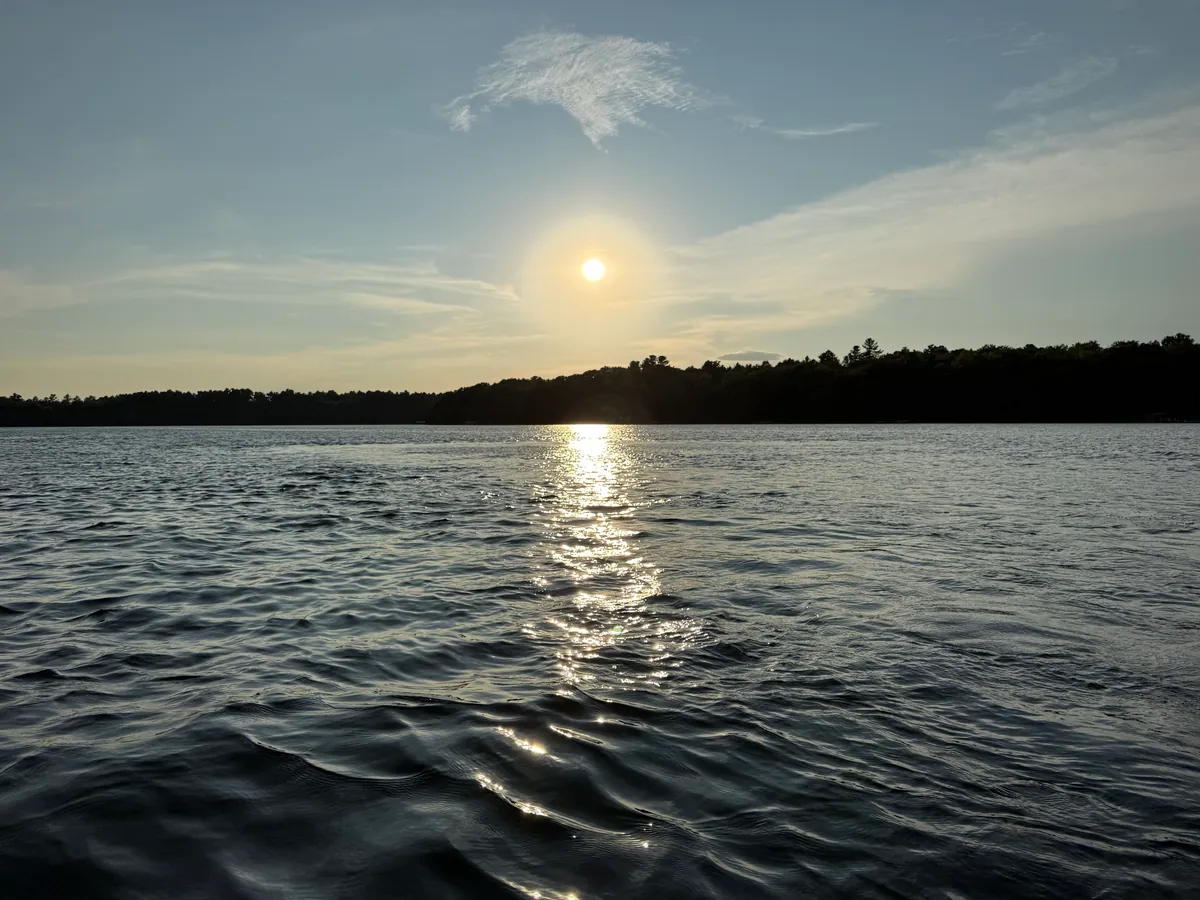
Cleanest Lakes in Virginia
Mouth of Witcher Cr. Lake in Bedford County leads the rankings on measured clarity and nutrients and 11.2 ft of clarity. Below are the top 50 cleanest monitored lakes in Virginia, ranked on EPA nutrient and algae measurements.
Ranked List
| # | Lake | County | Clarity | Phosphorus | Algae |
|---|---|---|---|---|---|
| 1 | Mouth of Witcher Cr. Lake | Bedford | 11.2 ft | 10 µg/L | 1.9 µg/L |
| 2 | Lower Blackwater River Lake | Franklin | 12.1 ft | 10 µg/L | 2.3 µg/L |
| 3 | Dam Lake | Franklin | 12.1 ft | 10 µg/L | 1.7 µg/L |
| 4 | Dam Lake | Pittsylvania | 10.5 ft | 10 µg/L | 2 µg/L |
| 5 | Dam Lake | Alleghany | 12.1 ft | 10 µg/L | 1.7 µg/L |
| 6 | Union Bridge Lake | Patrick | 8.2 ft | 10 µg/L | 2.7 µg/L |
| 7 | Hidden Valley Lake | Washington | 9.7 ft | 10 µg/L | 3.1 µg/L |
| 8 | Hunting Run Reservior Lake | Spotsylvania | 8.2 ft | 10 µg/L | 2.2 µg/L |
| 9 | Goose Point Lake | Franklin | 10.2 ft | 10 µg/L | 1.5 µg/L |
| 10 | Mouth Craddock Cr. Lake | Bedford | 10.2 ft | 10 µg/L | 1.6 µg/L |
| 11 | Cool Branch Lake | Franklin | 10.5 ft | 10 µg/L | 2.1 µg/L |
| 12 | Laurel Bed Lake | Russell | 9.8 ft | 10 µg/L | 3.8 µg/L |
| 13 | Confl. Blackwater River Lake | Bedford | 9.8 ft | 10 µg/L | 2 µg/L |
| 14 | Mouth of Bull Run Lake | Franklin | 10.2 ft | 10 µg/L | 2.1 µg/L |
| 15 | Carvins Cove Reservoir | Botetourt | 11.5 ft | 10 µg/L | 1.2 µg/L |
| 16 | Lee Hall Reservoir | Newport News city | 4.8 ft | 30 µg/L | 5.8 µg/L |
| 17 | Mouth Big Lick Cr. Lake | Alleghany | 12.5 ft | 10 µg/L | 1.7 µg/L |
| 18 | Motts Run Reservoir | Spotsylvania | 10.2 ft | 10 µg/L | 2.3 µg/L |
| 19 | Wise Lake | Wise | 10.5 ft | 10 µg/L | 2.2 µg/L |
| 20 | Lake Robertson | Rockbridge | 13.9 ft | 10 µg/L | 1.9 µg/L |
| 21 | West Arm Lake | Pulaski | 9.2 ft | 10 µg/L | 2.4 µg/L |
| 22 | Smith Lake | Stafford | 8.2 ft | 10 µg/L | 2.3 µg/L |
| 23 | Lake Keokee | Lee | 9.7 ft | 10 µg/L | 2.6 µg/L |
| 24 | Leesville Lakea-Topb-Middlec-Bot | Pittsylvania | 5.2 ft | 10 µg/L | 4 µg/L |
| 25 | Martinsville Reservoir | Henry | 8.5 ft | 10 µg/L | 2.1 µg/L |
| 26 | Talbott Reservoir | Patrick | 9.8 ft | 10 µg/L | 3.2 µg/L |
| 27 | Goose Creek Reservoir | Loudoun | 2.1 ft | 65 µg/L | 2.1 µg/L |
| 28 | Pedlar River Reservoir | Amherst | 7.5 ft | 10 µg/L | 5.5 µg/L |
| 29 | Beaverdam Creek Reservoir | Loudoun | 5.4 ft | 10 µg/L | 4 µg/L |
| 30 | Near Spillway Lake Mooney | Stafford | 9.2 ft | 10 µg/L | 1.4 µg/L |
| 31 | Coles Run Reservoir | Augusta | 25.8 ft | 5 µg/L | 0.5 µg/L |
| 32 | Lake Witten | Tazewell | 11.3 ft | 10 µg/L | 2.1 µg/L |
| 33 | Horseshoe Point Lake | Patrick | 9.8 ft | 10 µg/L | 1.7 µg/L |
| 34 | Diascund Reservoir Off Dam | New Kent | 3 ft | 30 µg/L | 11.5 µg/L |
| 35 | Hardy Ford Lake | Franklin | 3 ft | 40 µg/L | 5.5 µg/L |
| 36 | Lake Drummond | Chesapeake city | 0.7 ft | 60 µg/L | 7 µg/L |
| 37 | Mcveigh Ford Lake | Franklin | 3.9 ft | 30 µg/L | 0.6 µg/L |
| 38 | Lake Gaston | Mecklenburg | 4.3 ft | 20 µg/L | 3.9 µg/L |
| 39 | Near Dam Lake | Albemarle | 6.6 ft | 20 µg/L | 7.6 µg/L |
| 40 | Middle Blackwater River Lake | Franklin | 5.9 ft | 20 µg/L | 5.6 µg/L |
| 41 | Dam Lake | Pulaski | 8.5 ft | 20 µg/L | 6.4 µg/L |
| 42 | Hales Ford Lake | Franklin | 4.9 ft | 20 µg/L | 8.8 µg/L |
| 43 | Confl. Beaverdam Cr. Lake | Bedford | 4.3 ft | 20 µg/L | 12.5 µg/L |
| 44 | Peak Creek Lake | Pulaski | 5.6 ft | 20 µg/L | 4.6 µg/L |
| 45 | State Park Lake | Pulaski | 7.5 ft | 20 µg/L | 7.9 µg/L |
| 46 | Mouth Peak Cr. Lake | Pulaski | 6.9 ft | 20 µg/L | 6.5 µg/L |
| 47 | Confl. Indian Cr. Lake | Franklin | 4.6 ft | 20 µg/L | 11.2 µg/L |
| 48 | Gills Creek Lake | Franklin | 6.2 ft | 20 µg/L | 4.6 µg/L |
| 49 | Speights Run | Suffolk city | 3.1 ft | 40 µg/L | 25.8 µg/L |
| 50 | Dublin Water Works Lake | Pulaski | 7.2 ft | 10 µg/L | 7.6 µg/L |
More Answers for Virginia
Get Virginia water-quality updates
New readings can change this ranking. Unsubscribe anytime.