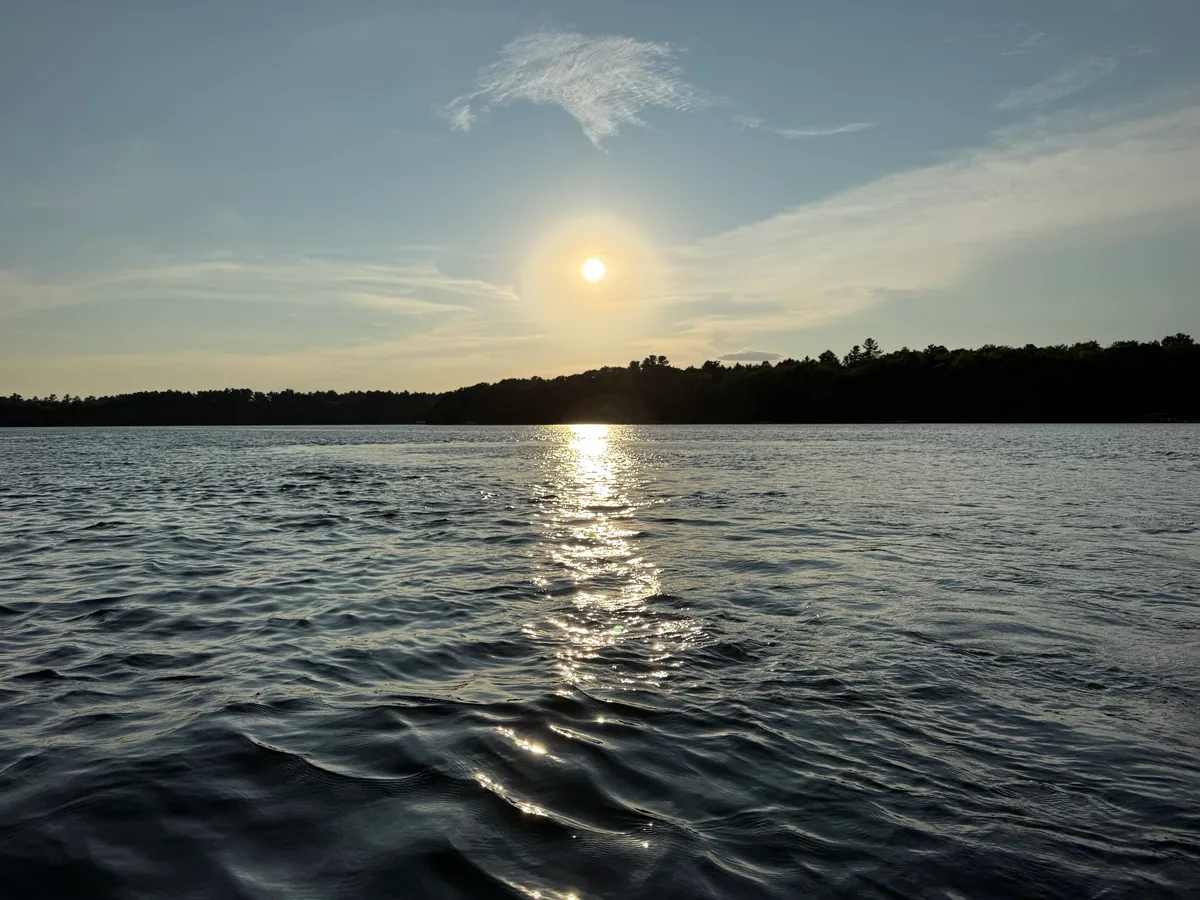
Cleanest Lakes in Rutland County, Vermont
Lake St. Catherine in Rutland County leads the rankings on measured clarity and nutrients and 15.4 ft of clarity. Below are the top 25 cleanest monitored lakes in Rutland County, Vermont, ranked on EPA nutrient and algae measurements.
Ranked List
| # | Lake | County | Clarity | Phosphorus | Algae |
|---|---|---|---|---|---|
| 1 | Lake St. Catherine | Rutland | 15.4 ft | 13.2 µg/L | 2.7 µg/L |
| 2 | Wallingford Pond | Rutland | 7.1 ft | 15.3 µg/L | 3.9 µg/L |
| 3 | Lake Hortonia | Rutland | 14.8 ft | 15.5 µg/L | 2.8 µg/L |
| 4 | Echo Lake | Rutland | 24.3 ft | 10.1 µg/L | 1.3 µg/L |
| 5 | Sunset Lake | Rutland | 36.1 ft | 8.5 µg/L | 1.3 µg/L |
| 6 | Chipman Lake | Rutland | 9.4 ft | 15.9 µg/L | 4.1 µg/L |
| 7 | Lake Bomoseen | Rutland | 23.6 ft | 9.7 µg/L | 1.2 µg/L |
| 8 | Elfin Lake | Rutland | 10.8 ft | 13.6 µg/L | 4 µg/L |
| 9 | Lake Ninevah | Rutland | 8.2 ft | 11.4 µg/L | 2 µg/L |
| 10 | Danby Pond | Rutland | 2 ft | 15.3 µg/L | 2.8 µg/L |
| 11 | Little Pond | Rutland | 4.9 ft | 16.1 µg/L | 3.4 µg/L |
| 12 | High Pond | Rutland | 21.3 ft | 16.6 µg/L | 3.5 µg/L |
| 13 | Spring Lake | Rutland | 21.3 ft | 21.6 µg/L | 2.1 µg/L |
| 14 | Old Marsh Pond | Rutland | - | - | - |
| 15 | Pine Pond | Rutland | - | - | - |
| 16 | Muddy Pond | Rutland | - | - | - |
| 17 | Johnson Pond | Rutland | - | - | - |
| 18 | Lefferts Pond | Rutland | - | - | - |
| 19 | Colton Pond | Rutland | - | - | - |
| 20 | Hinkum Pond | Rutland | - | - | - |
| 21 | Huff Pond | Rutland | - | - | - |
| 22 | Burr Pond | Rutland | - | - | - |
| 23 | Strong Swamp | Rutland | - | - | - |
| 24 | Billings Marsh | Rutland | - | - | - |
| 25 | Coggman Pond | Rutland | - | - | - |
More Answers for Rutland County, Vermont
Get Rutland County, Vermont water-quality updates
New readings can change this ranking. Unsubscribe anytime.